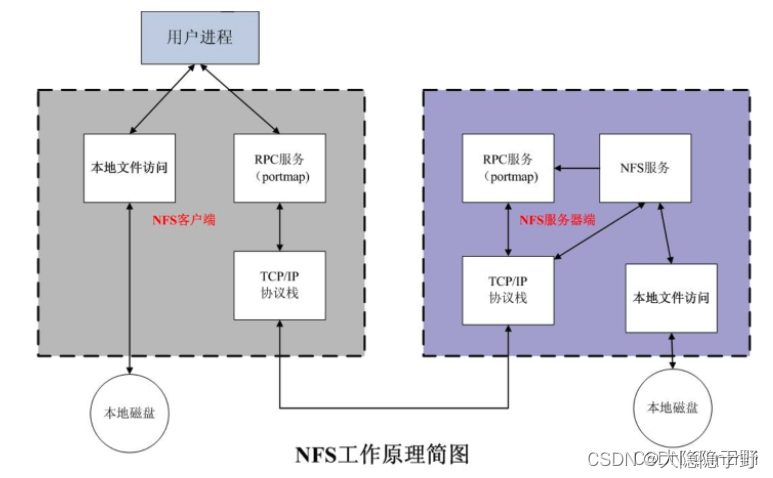
NFS性能瓶颈分析
前言
atop – run it with -d option or press d to toggle the disk stats view.
iostat – try it with the -xm 2 options for extended statistics, in megabytes, and in two-second intervals.
iotop – top-like I/O monitor. Try it with the -oPa options to show the accumulated I/O of active processes only.
ps – use auxf, then under the “STAT” column “D” usually indicates disk iowait.
strace – view the actual operations issued by a process. Read the strace man page.
lsof – after you’ve identified the process responsible, use -p [PID] to find the specific files.
nfsiostat 是nfs-utils的一部分,参考了iostat,主要展示本机作为NFS客户端周期的统计数据
nfsiostat
nfsiostat是nfs-utils的一部分,参考了iostat,主要展示本机作为NFS客户端周期的统计数据
命令格式
nfsiostat [[<interval>] [<count>]] [<options>][<mount_point>]
官方命令文档

- op/s
This is the number of operations per second.
- rpc bklog
This is the length of the backlog queue.
- kB/s
This is the number of kB written/read per second.
- kB/op
This is the number of kB written/read per each operation.
- retrans
This is the number of retransmissions.
- avg RTT (ms)
This is the duration from the time that client's kernel sends the RPC request until the time it receives the reply.
- avg exe (ms)
This is the duration from the time that NFS client does the RPC request to its kernel until the RPC request is completed, this includes the RTT time above.
- avg queue (ms)
This is the duration from the time the NFS client created the RPC request task to the time the request is transmitted.
- errors
This is the number of operations that completed with an error status (status < 0). This count is only available on kernels with RPC iostats version 1.1 or above.
kB/op:每次操作的平均包大小,可以作为mount里的参数rsize,wsize参考
avg RTT (ms):客户端从kernel发出RPC请求 到 接收到回复的时间
avg exex(ms): 包含了 avg RTT, 是客户端发从请求到请求结束的时间
Avg RTT= network latency + NFS storage latency.
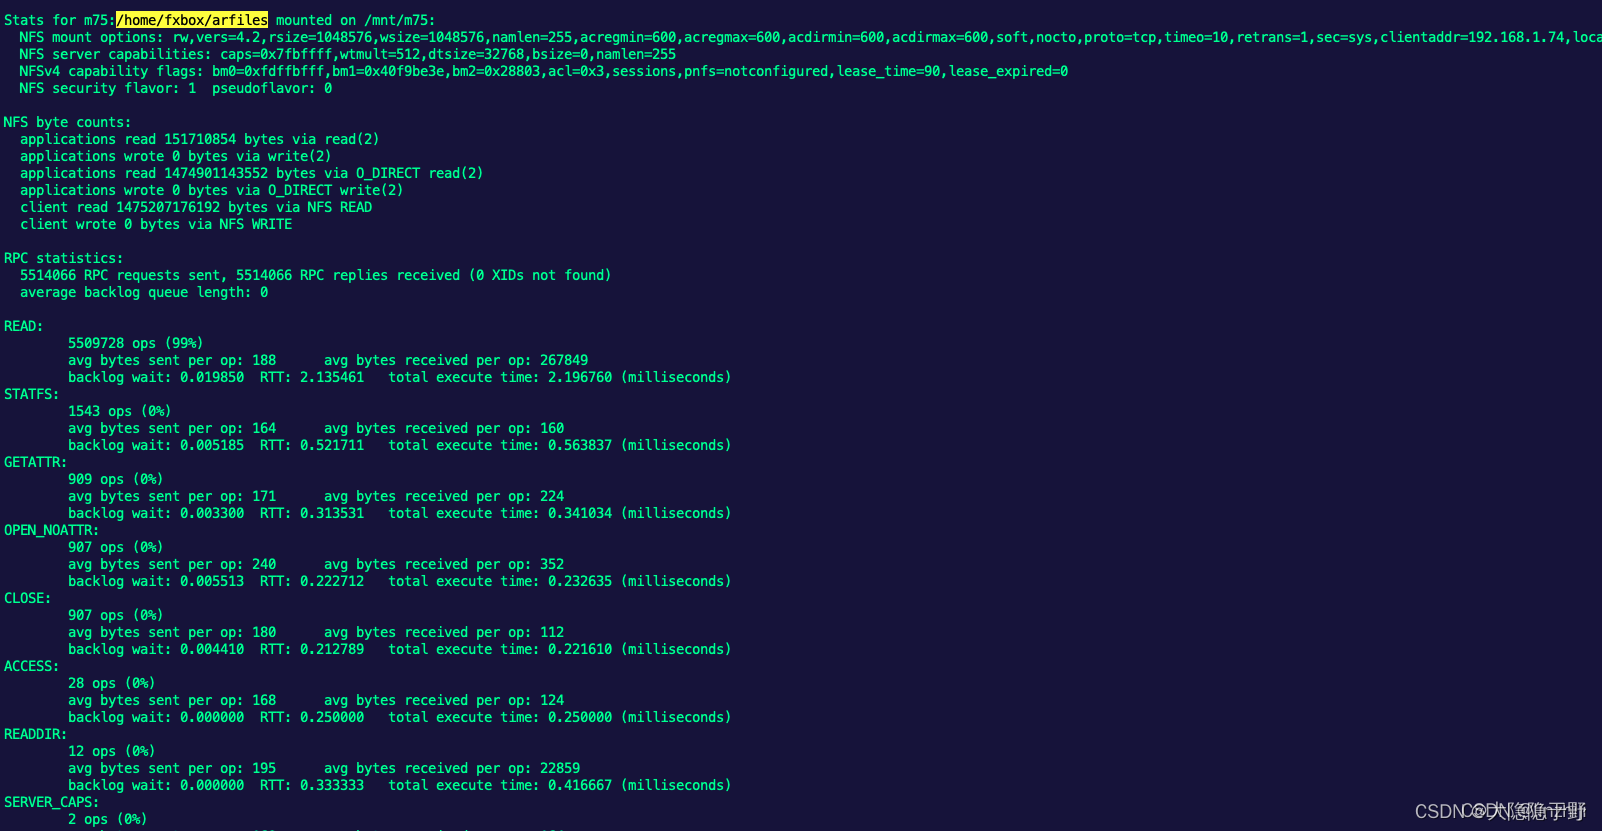
mountstats
官方文档
iostat
官方文档
iostat [ -c ] [ -d ] [ -h ] [ -k | -m ] [ -N ] [ -s ] [ -t ] [ -V
] [ -x ] [ -y ] [ -z ] [ --dec={ 0 | 1 | 2 } ] [ { -f | +f }
directory ] [ -j { ID | LABEL | PATH | UUID | ... } ] [ -o JSON ]
[ [ -H ] -g group_name ] [ --human ] [ --pretty ] [ -p [
device[,...] | ALL ] ] [ device [...] | ALL ] [ interval [ count
] ]
options 操作项,interval指定统计时间间隔,count总共输出次数222222
#iostat 会每2秒更新一次,一共打印5次信息, -x 的选项是打印出扩展信息
iostat -x 2 5
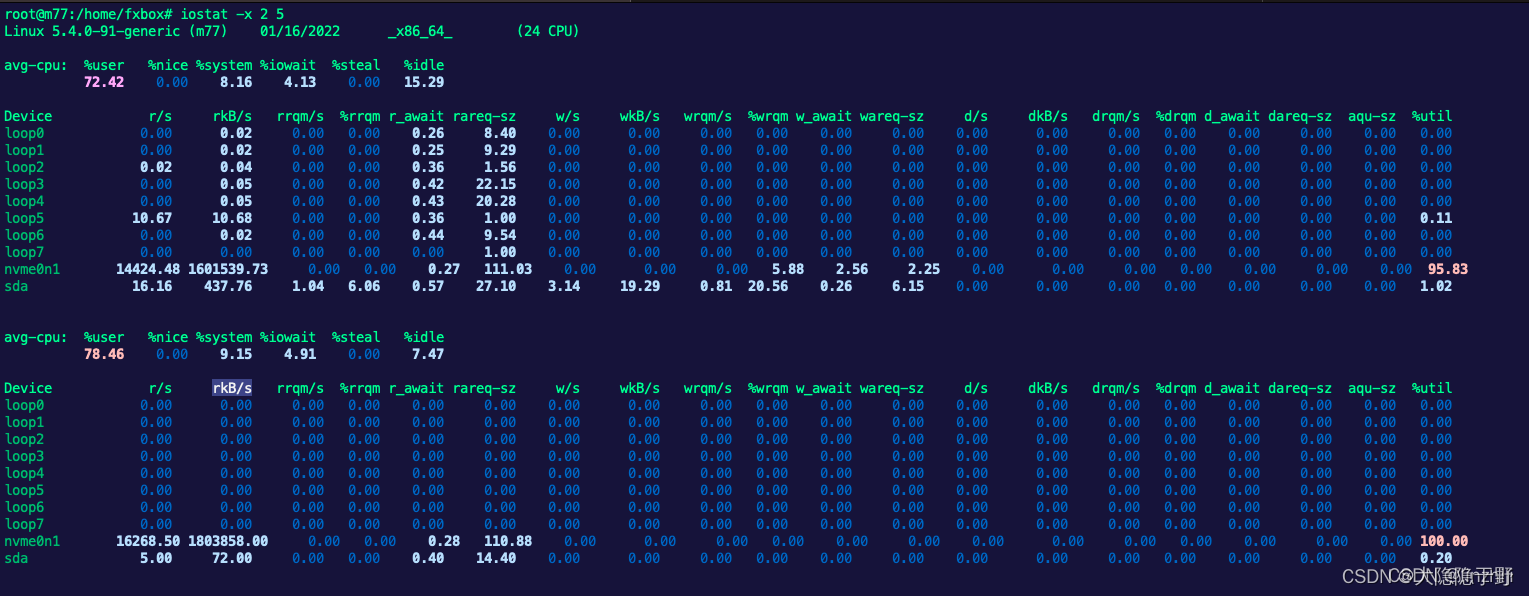
avg-cpu %user %nice %system %iowait %steal %idle
78.26 0.00 9.84 4.13 0.00 7.77
user: user 级别的cpu使用占比
nice:
system: kernel 解绑cpu使用占比
iowait: 等待io的占比
steal: Show the percentage of time spent in involuntary wait by the virtual CPU or CPUs while the hypervisor was servicing another virtual processor
Device r/s rkB/s rrqm/s %rrqm r_await rareq-sz w/s wkB/s wrqm/s %wrqm w_await wareq-sz d/s dkB/s drqm/s %drqm d_await dareq-sz aqu-sz %util
nvme0n1 14426.57 1601785.67 0 0 0.27 111.03 0 0 0 5.88 2.56 2.25 0 0 0 0 0 0 0 95.86
r/s: request/ per second
rkB/s, rMB/s: 每秒读的字节数
rrqm/s: 读请求每秒加入磁盘队列的数量
%rrqm:通上,单位百分比
r_await: 单位milliseconds,完成读请求平均时间,包括队列中的时间
rareq-sz: 平均每次请求的大小,单位KB
r:read 读,w:write 写,d:discard 抛弃, w和d的参数参考r,不细写了
aqu-sz:磁盘平均队列长度
util:bandwidth utilization for the device。Percentage of elapsed time during which I/O requests were issued to the device (bandwidth utilization for the device). Device saturation occurs when this value is close to 100% for devices serving requests serially. But for devices serving requests in parallel, such as RAID arrays and modern SSDs, this number does not reflect their performance limits.
util:在统计时间内所有处理IO时间,除以总共统计时间。
例如,如果统计间隔1秒,该设备有0.8秒在处理IO,而0.2秒闲置,那么该设备的%util = 0.8/1 = 80%,所以该参数暗示了设备的繁忙程度。
一般地,如果该参数是100%表示设备已经接近满负荷运行了
(当然如果是多磁盘,即使%util是100%,因为磁盘的并发能力,所以磁盘使用未必就到了瓶颈)
nfstat
nfsstat(8) - Linux manual page
Ubuntu Manpage: nfsstat - list NFS statistics
/proc/net/rpc/nfsd
procfs-based interface to kernel NFS server statistics.
/proc/net/rpc/nfs
procfs-based interface to kernel NFS client statistics.
/proc/mounts
procfs-based interface to the mounted filesystems.
# server信息
nfsstat -s
# clinet 信息
nfsstat -c
nfsd
Ubuntu Manpage: nfsd - special filesystem for controlling Linux NFS server
rpc.nfsd
Ubuntu Manpage: rpc.nfsd - NFS server process