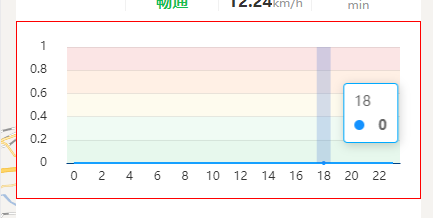
initChartsBox() {this.option = {tooltip: {trigger: "axis",axisPointer: {// 方法一type: "shadow", // 默认为直线,可选为:'line' | 'shadow'shadowStyle: {color: "rgba(41, 95, 204, 0.2)",},},borderColor: "rgba(0, 170, 255)", // 边框颜色}, // 坐标轴指示器配置textStyle: {color: "#333", // xy轴的提示文字颜色,不包含背景刻度线},color: ["#1492FF"],grid: {top: "25px",left: "50px",right: "20px",bottom: "35px",},xAxis: [{type: "category",data: this.chartsData.time,axisLine: {show: true,lineStyle: {color: "#004080",// width: 0,// type: "solid",}, // x轴线的颜色以及宽度},// axisLabel: {// show: true,// textStyle: {// color: "rgba(255, 255, 255, 0.3)",// }// }, // x轴文字的配置splitLine: {show: false,lineStyle: {}, // 分割线配置},axisTick: {show: false,}, // x轴的刻度线},],yAxis: [{type: "value",splitLine: {show: true,lineStyle: {color: "#333",opacity: 0.1,}, // 设置横向的线的颜色},axisLabel: {show: true,margin: 20,// textStyle: {// color: "rgba(255, 255, 255, 0.3)",// }, // y轴的字体配置},splitArea: {show: true,areaStyle: {color: ['rgba(21, 190, 80, 0.1)','rgba(109, 217, 147, 0.1)','rgba(245, 221, 102, 0.11)','rgba(255, 107, 0, 0.1)','rgba(212, 0, 0, 0.1)',]}}},],series: [{data: this.chartsData.roadNorm,type: "line",smooth: true,symbolSize: 0, // 设置圆点大小为 0,即不显示圆点},],};this.myChart = this.$echarts.init(document.getElementById("chartsBox")); // 图标初始化this.myChart.setOption(this.option); // 渲染页面var that = this;let index = 0;this.eChartsTimer = setInterval(function () {let len = that.chartsData.time.length;if (index >= len) {index = 0;}that.myChart.dispatchAction({type: "showTip", // 提示框seriesIndex: 0,dataIndex: index, // 第 lightIndex 柱子高亮});index += 1}, 1000);/* ECharts动态效果 */window.addEventListener("resize", () => {this.myChart.resize();});},

