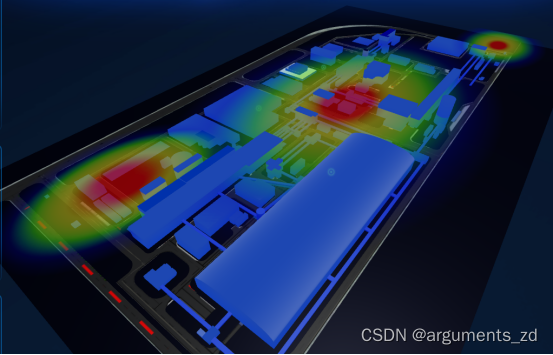
七、热力图展示
在开发3d模型之中,热力图是非常常见的需求,比如需要了解人口密度,空气质量,热力分布等这些都需要热力图来展示,那么3d常见的热力图是怎么实现的呢,现在我们就来看看。先看效果图。
思路:
1引入heatmap.js,h337是他自带的一个暴漏的方法用于使用
2创建myheatmap.js用于创建一个HeatMapCanvas实例,使用canvas对象创建
3在city.js引入并贴图展示
第一步
npm install heatmap.js --save第二步
import h337 from '@rengr/heatmap.js'
export function getHeatmapCanvas (points, x = 500, y = 160) {var canvasBox = document.createElement('div')document.body.appendChild(canvasBox)canvasBox.style.width = x + 'px'canvasBox.style.height = y + 'px'canvasBox.style.position = 'absolute'var heatmapInstance = h337.create({container: canvasBox,backgroundColor: 'rgba(255, 255, 255, 0)', // '#121212'    'rgba(0,102,256,0.2)'radius: 20, // [0,+∞)minOpacity: 0,maxOpacity: 0.6,})// 构建一些随机数据点,这里替换成你的业务数据var dataif (points && points.length) {data = {max: 40,min: 0,data: points,}} else {let randomPoints = []var max = 0var cwidth = xvar cheight = yvar len = 300while (len--) {var val = Math.floor(Math.random() * 30 + 20)max = Math.max(max, val)var point = {x: Math.floor(Math.random() * cwidth),y: Math.floor(Math.random() * cheight),value: val,}randomPoints.push(point)}data = {max: 60,min: 15,data: randomPoints,}}// 因为data是一组数据,所以直接setDataheatmapInstance.setData(data)let canvas = canvasBox.querySelector('canvas')document.body.removeChild(canvasBox)return canvas
}
第三步,外部调用,记得要首先删除原先的点
import { getHeatmapCanvas } from './myheatmap'
//生成热力图
function initHeatMap () {removeHeatmap()let data1 = [{x: 120,y: 50,value: 400,radius: 80}]let res1 = getHeatmapCanvas(data1, 500, 600)createPlaneByCanvas('first', res1, {x: 0,y: 70,z: 86})
}//创建热力图模板
function createPlaneByCanvas (name, canvas, position = {}, size = { x: 400, y: 760 }, rotation = {}) {var geometry = new THREE.PlaneGeometry(size.x, size.y)var texture = new THREE.CanvasTexture(canvas)var material = new THREE.MeshBasicMaterial({map: texture,side: THREE.DoubleSide,transparent: true// color: '#fff'})texture.needsUpdate = trueconst plane = new THREE.Mesh(geometry, material)plane.material.side = 2plane.position.x = position.x || 0plane.position.y = position.y || 0plane.position.z = position.z || 0plane.rotation.x = rotation.x || 1.5707963267948966plane.rotation.y = rotation.y || 0plane.rotation.z = rotation.z || 0plane.name = nameplaneGroup.push(plane)// floor2Group.add(plane)scene.add(plane)
}
以上就是如何在3d模型中展示热力图的步骤,还是要在实战中慢慢体会才能完成自己技术的提升,有什么疑问可以留言和私信我哦,下期讲解更加炫酷的发光墙如何开发,大家期待着吧。