Python与数据分析--每天绘制Matplotlib库实例图片3张-第1天
目录
1.实例1--Bar color demo
2.实例2--Bar Label Demo
3.实例3--Grouped bar chart with labels
1.实例1--Bar color demo
import matplotlib.pyplot as plt
# 支持中文
plt.rcParams['font.sans-serif'] = ['SimHei'] # 用来正常显示中文标签
plt.rcParams['axes.unicode_minus'] = False # 用来正常显示负号fig, ax = plt.subplots()fruits = ['苹果', '蓝莓', '樱桃', '橘子']
counts = [40, 100, 30, 55]
bar_labels = ['red', 'blue', 'pink', 'orange']
bar_colors = ['tab:red', 'tab:blue', 'tab:pink', 'tab:orange']ax.bar(fruits, counts, label=bar_labels, color=bar_colors)
ax.set_ylabel('水果供应数量')
ax.set_title('水果供应数量图')
ax.legend(title='Fruit color')
plt.savefig(r"C:\Users\Zeng Zhong Yan\Desktop\py.vs\python学习\1.水果供应数量图.png",dpi=500)
plt.show()
2.实例2--Bar Label Demo
import matplotlib.pyplot as plt
import numpy as npplt.rcParams['font.sans-serif'] = ['SimHei'] # 用来正常显示中文标签
plt.rcParams['axes.unicode_minus'] = False # 用来正常显示负号species = ('Adelie', 'Chinstrap', 'Gentoo')
Male_data=np.array([73, 54, 61])
Female_data=np.array([73, 34, 58])
sex_counts = {'Male':Male_data,'Female':Female_data ,}width=0.6#条形图的宽度
fig, ax = plt.subplots()
bottom = np.zeros(3)
for sex, sex_count in sex_counts.items():p = ax.bar(species, sex_count, width, label=sex,bottom=bottom)bottom += sex_countax.bar_label(p, label_type='center')ax.set_title('企鹅性别数量统计图')
ax.legend(edgecolor='y')
plt.savefig(r"C:\Users\Zeng Zhong Yan\Desktop\py.vs\python学习\2.企鹅性别数量统计图.png",dpi=500)
plt.show()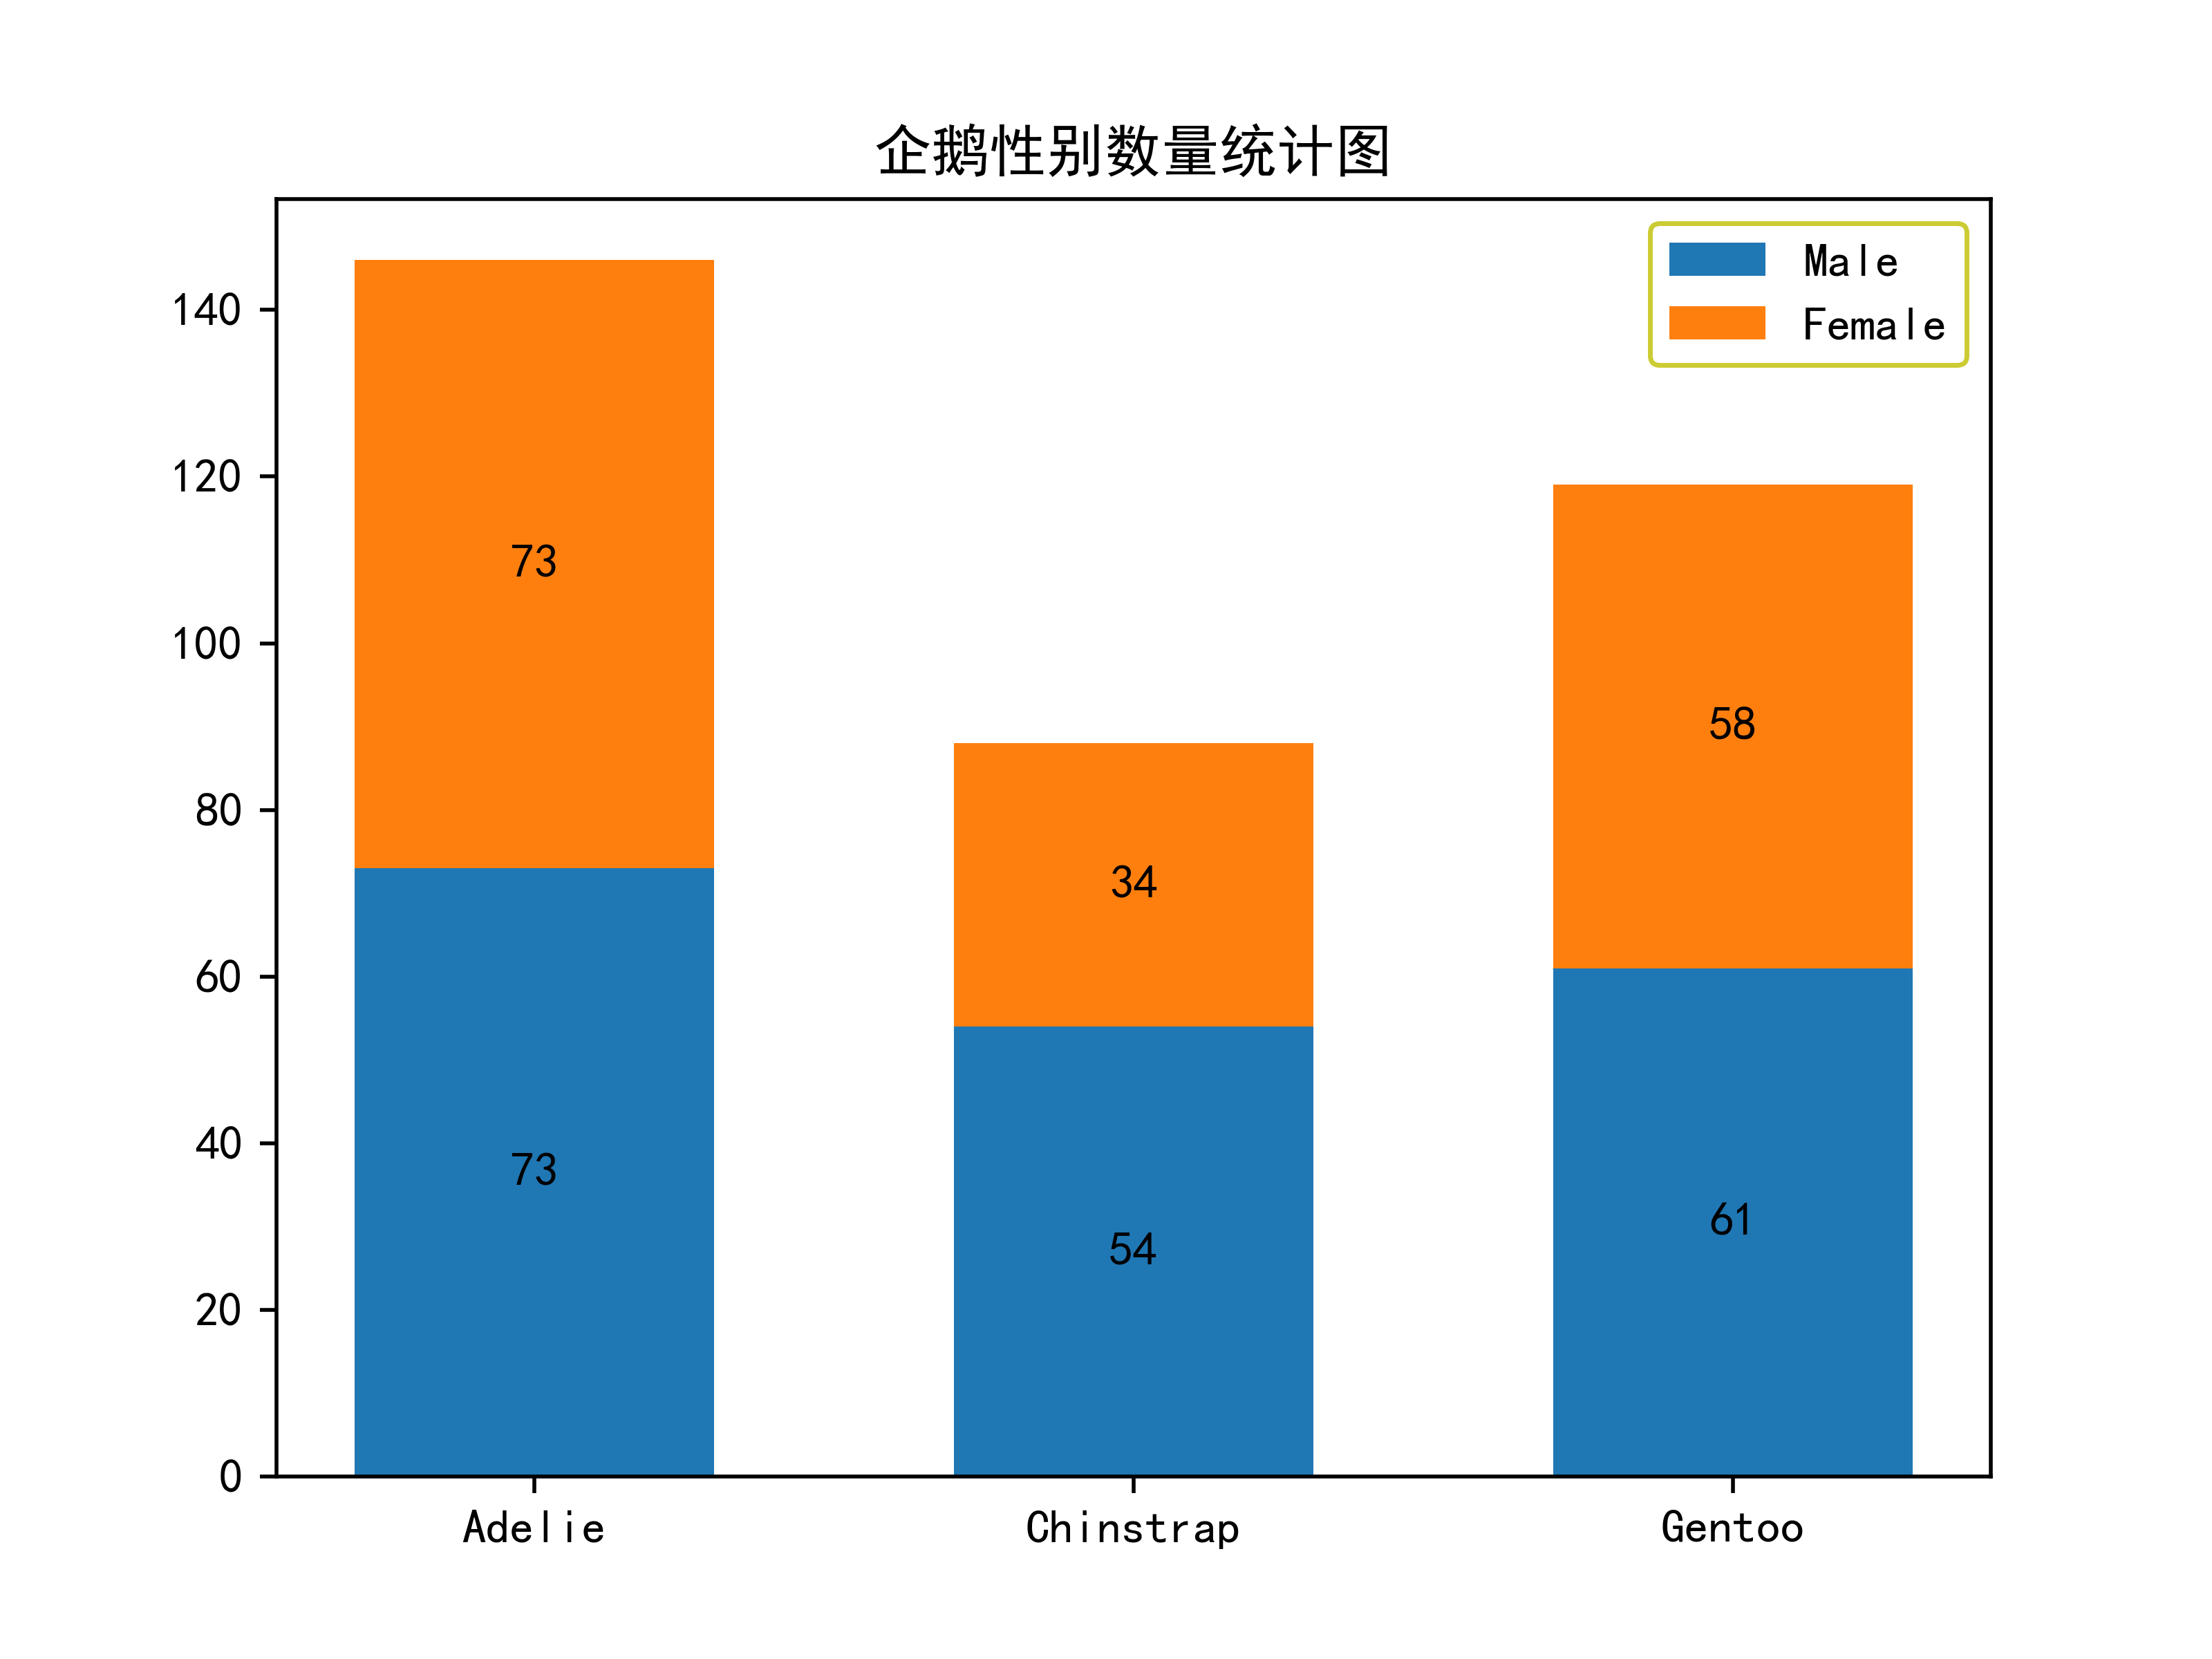
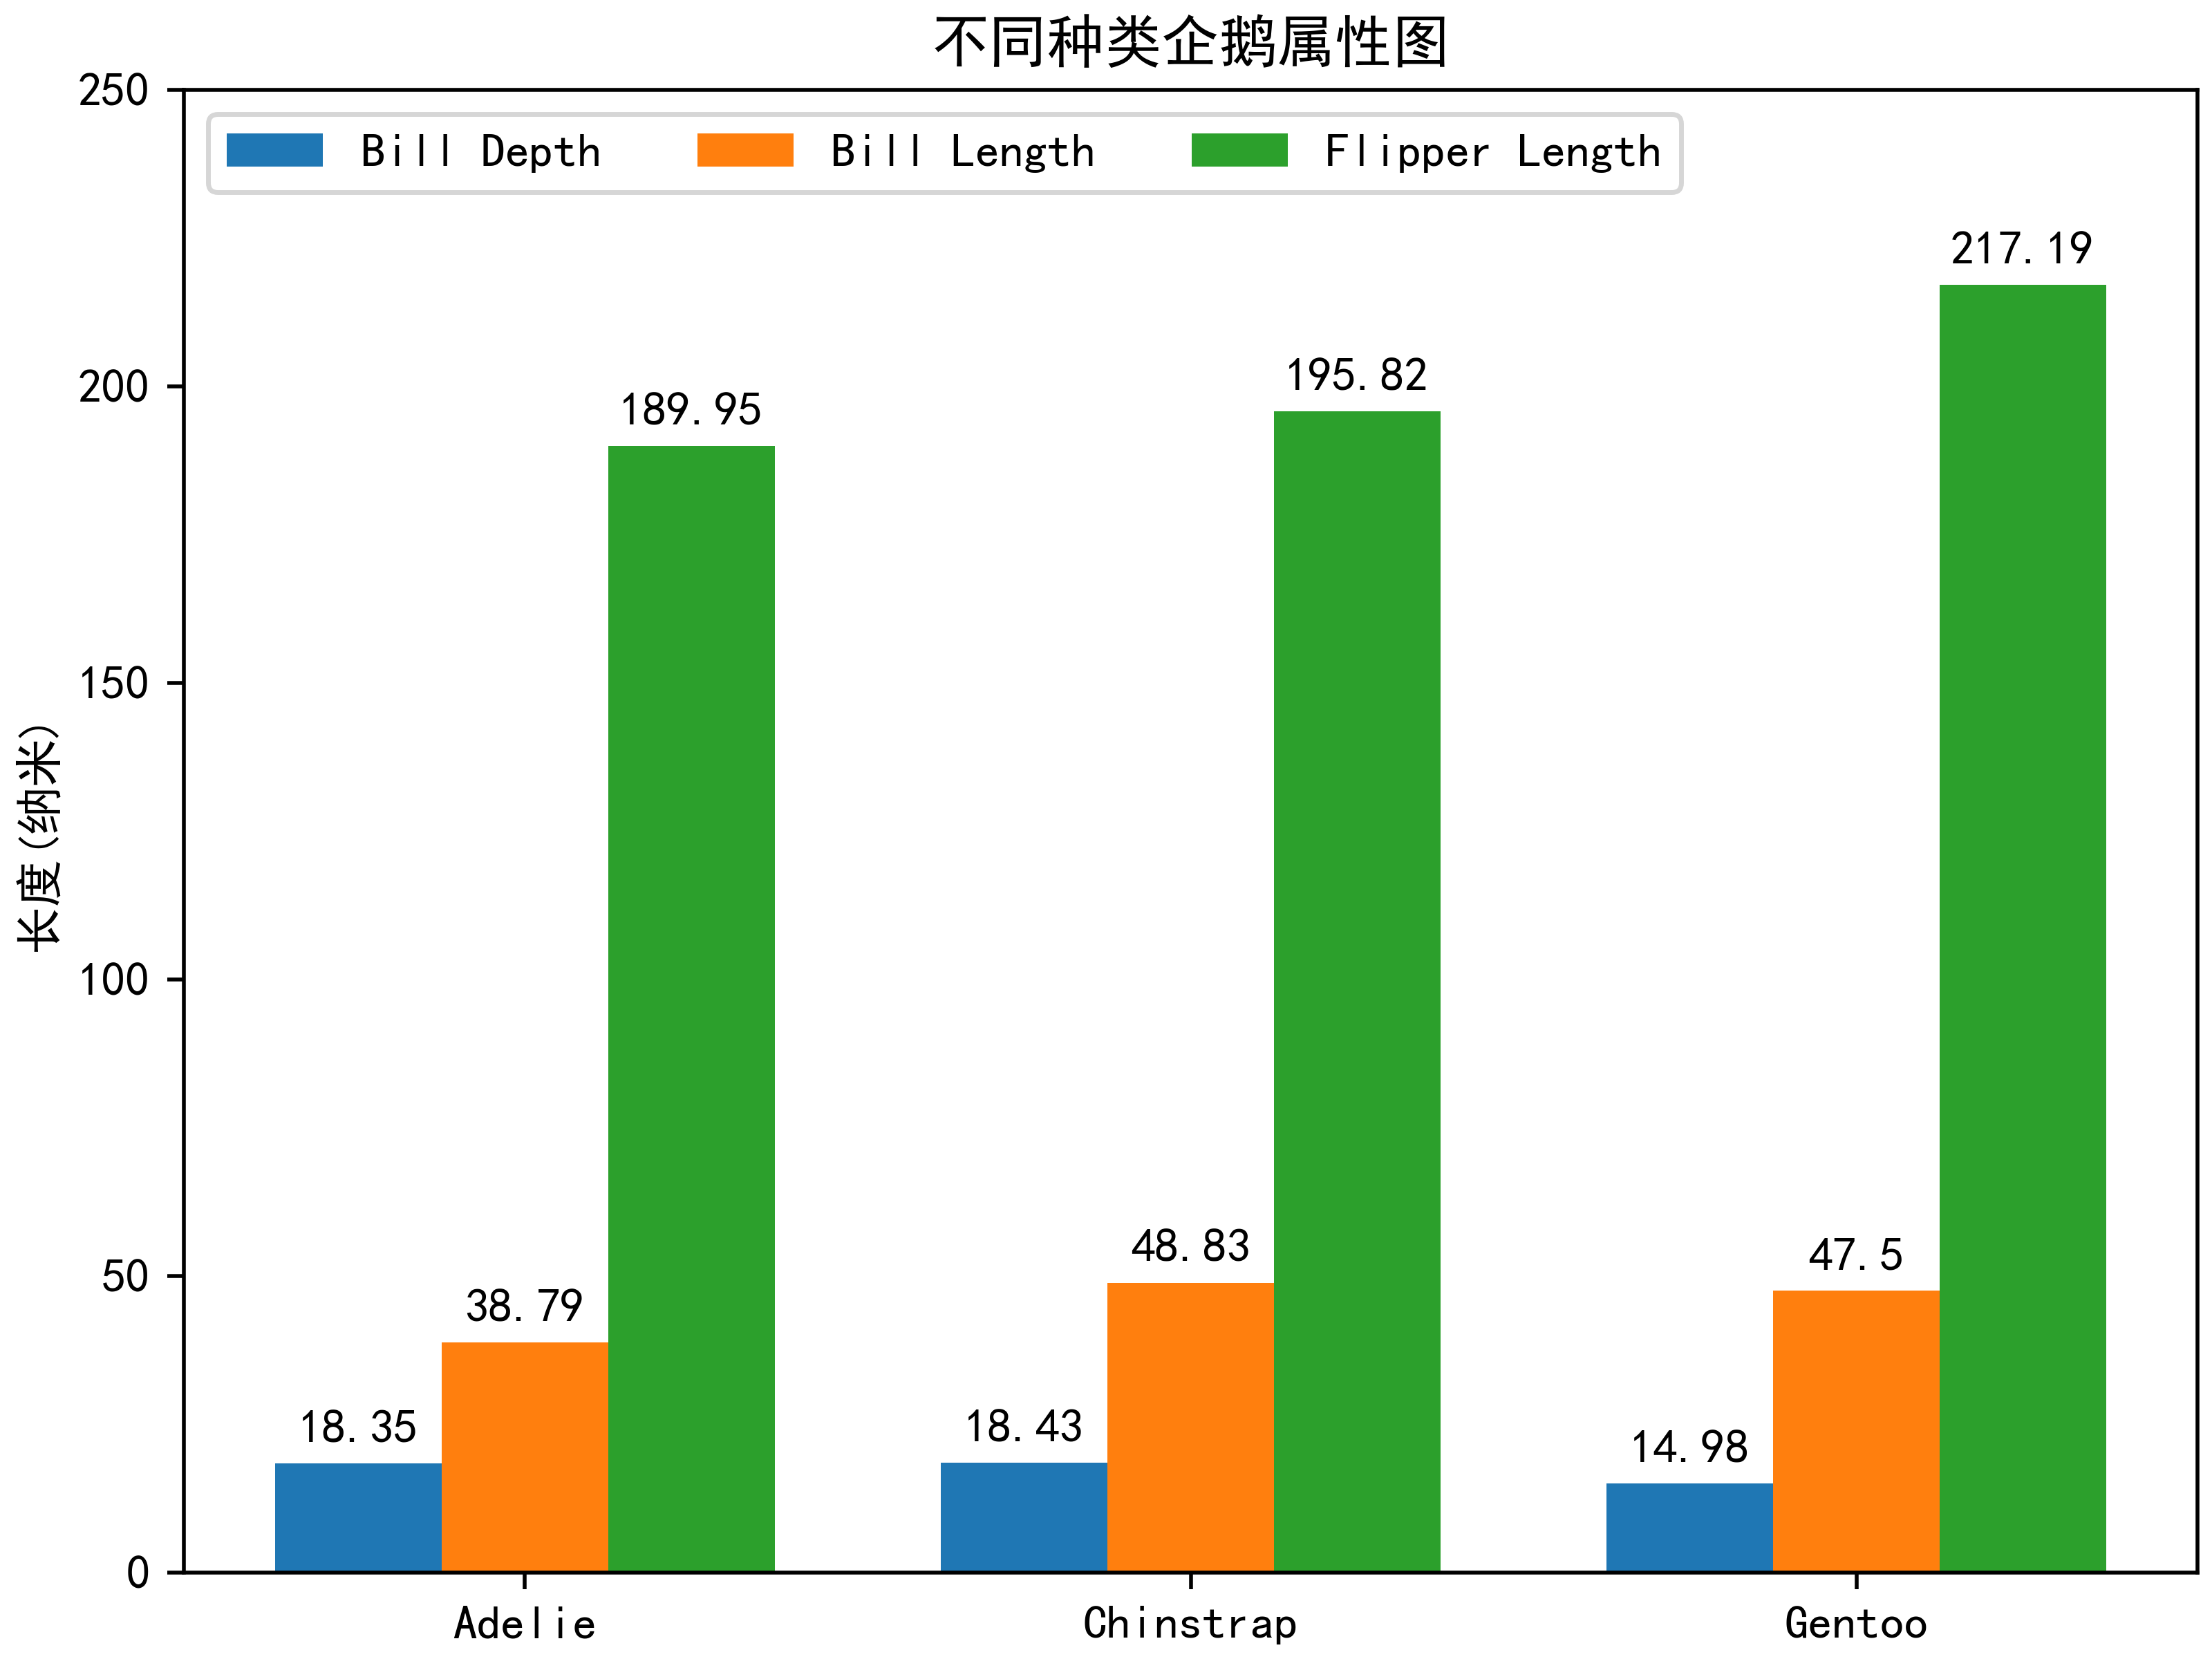
3.实例3--Grouped bar chart with labels
import matplotlib.pyplot as plt
import numpy as np
plt.rcParams['font.sans-serif'] = ['SimHei'] # 用来正常显示中文标签
plt.rcParams['axes.unicode_minus'] = False # 用来正常显示负号
x_label=[ "Adelie", "Chinstrap", "Gentoo"]
data = {'Bill Depth': (18.35, 18.43, 14.98),'Bill Length': (38.79, 48.83, 47.50),'Flipper Length': (189.95, 195.82, 217.19),
}x = np.arange(len(x_label))
width = 0.25
multiplier = 0fig, ax = plt.subplots(layout='constrained')
for attribute, measurement in data.items():offset = width * multiplierrects = ax.bar(x + offset, measurement, width, label=attribute)ax.bar_label(rects, padding=3)multiplier += 1ax.set_ylabel('长度(纳米)')
ax.set_title('不同种类企鹅属性图')
ax.set_xticks(x + width,x_label)
ax.legend(loc='upper left', ncols=3)
ax.set_ylim(0, 250)
plt.savefig(r"C:\Users\Zeng Zhong Yan\Desktop\py.vs\python学习\3.不同种类企鹅属性图.png",dpi=500)
plt.show()