Spring Boot应用如何快速接入Prometheus监控
1. Micrometer简介
Micrometer为Java平台上的性能数据收集提供了一个通用的API,它提供了多种度量指标类型(Timers、Guauges、Counters等),同时支持接入不同的监控系统,例如Influxdb、Graphite、Prometheus等。可以通过Micrometer收集Java性能数据,配合Prometheus监控系统实时获取数据,并最终在Grafana上展示出来,从而很容易实现应用的监控。
Micrometer中有两个最核心的概念,分别是计量器(Meter)和计量器注册表(MeterRegistry)。计量器用来收集不同类型的性能指标信息,Micrometer提供了如下几种不同类型的计量器:
计数器(Counter): 表示收集的数据是按照某个趋势(增加/减少)一直变化的,也是最常用的一种计量器,例如接口请求总数、请求错误总数、队列数量变化等。
计量仪(Gauge): 表示搜集的瞬时的数据,可以任意变化的,例如常用的CPU Load、Memory使用量、Network使用量、实时在线人数统计等,
计时器(Timer): 用来记录事件的持续时间,这个用的比较少。
分布概要(Distribution summary): 用来记录事件的分布情况,表示一段时间范围内对数据进行采样,可以用于统计网络请求平均延迟、请求延迟占比等。
springboot集成Micrometer
pom.xml依赖
<project xmlns="http://maven.apache.org/POM/4.0.0" xmlns:xsi="http://www.w3.org/2001/XMLSchema-instance" xsi:schemaLocation="http://maven.apache.org/POM/4.0.0 https://maven.apache.org/xsd/maven-4.0.0.xsd"><modelVersion>4.0.0</modelVersion><groupId>com.olive</groupId><artifactId>prometheus-demo</artifactId><version>0.0.1-SNAPSHOT</version><parent><groupId>org.springframework.boot</groupId><artifactId>spring-boot-starter-parent</artifactId><version>2.3.7.RELEASE</version><relativePath /></parent><properties><java.version>1.8</java.version><project.build.sourceEncoding>UTF-8</project.build.sourceEncoding><project.reporting.outputEncoding>UTF-8</project.reporting.outputEncoding><spring-boot.version>2.3.7.RELEASE</spring-boot.version></properties><dependencies><dependency><groupId>org.springframework.boot</groupId><artifactId>spring-boot-starter-web</artifactId></dependency><dependency><groupId>org.springframework.boot</groupId><artifactId>spring-boot-starter-actuator</artifactId></dependency><!-- Micrometer Prometheus registry  --><dependency><groupId>io.micrometer</groupId><artifactId>micrometer-registry-prometheus</artifactId></dependency></dependencies><dependencyManagement><dependencies><dependency><groupId>org.springframework.boot</groupId><artifactId>spring-boot-dependencies</artifactId><version>${spring-boot.version}</version><type>pom</type><scope>import</scope></dependency></dependencies></dependencyManagement>
</project>
application.yml配置
#添加以下配置用于暴露指标
management:endpoints:web:exposure:# 所有端点都对外暴露可访问到include: '*'metrics:tags:application: ${spring.application.name}spring:application:name: prometheus-demomanagement.endpoints.web.exposure.include配置为开启Actuator服务,因为Spring Boot Actuator会自动配置一个URL为/actuator/Prometheus的HTTP服务来供Prometheus抓取数据,不过默认该服务是关闭的,该配置将打开所有的Actuator服务。management.metrics.tags.application配置会将该工程应用名称添加到计量器注册表的tag中去,方便后边 Prometheus 根据应用名称来区分不同的服务。
springboot启动引导类
package com.olive;import org.springframework.boot.SpringApplication;
import org.springframework.boot.autoconfigure.SpringBootApplication;@SpringBootApplication
public class Application {public static void main(String[] args) {SpringApplication.run(Application.class, args);}}
注册MeterRegistryCustomizer
其实引入了依赖,通过Actuator暴露你需要暴露的端点之后,对应的Micrometer就会自动配置。但是为了方便监控,建议我们对应用服务配置一些特殊的tag来更加准确的描述我们的监控实例:
package com.olive.config;import org.springframework.beans.factory.annotation.Value;
import org.springframework.boot.actuate.autoconfigure.metrics.MeterRegistryCustomizer;
import org.springframework.context.annotation.Bean;
import org.springframework.context.annotation.Configuration;import io.micrometer.core.instrument.MeterRegistry;@Configuration
public class MicrometerConfig {@Value("${spring.application.name}")private String applicationName;@Beanpublic MeterRegistryCustomizer configurer(MeterRegistry meterRegistry) {return registry -> meterRegistry.config().commonTags("application", applicationName, "instance", applicationName + "_instance");}}
以上的tag组合可以更好的来标识你的应用,特别在集群当中。
定义测试接口
package com.olive.controller;import org.slf4j.Logger;
import org.slf4j.LoggerFactory;
import org.springframework.web.bind.annotation.GetMapping;
import org.springframework.web.bind.annotation.RestController;@RestController
public class TestController {Logger logger = LoggerFactory.getLogger(TestController.class);@GetMapping("/test")public String test() {logger.info("test");return "ok";}@GetMapping("/")public String home() {logger.info("home");return "ok";}
}
启动服务并访问
http://localhost:8080/actuator/prometheus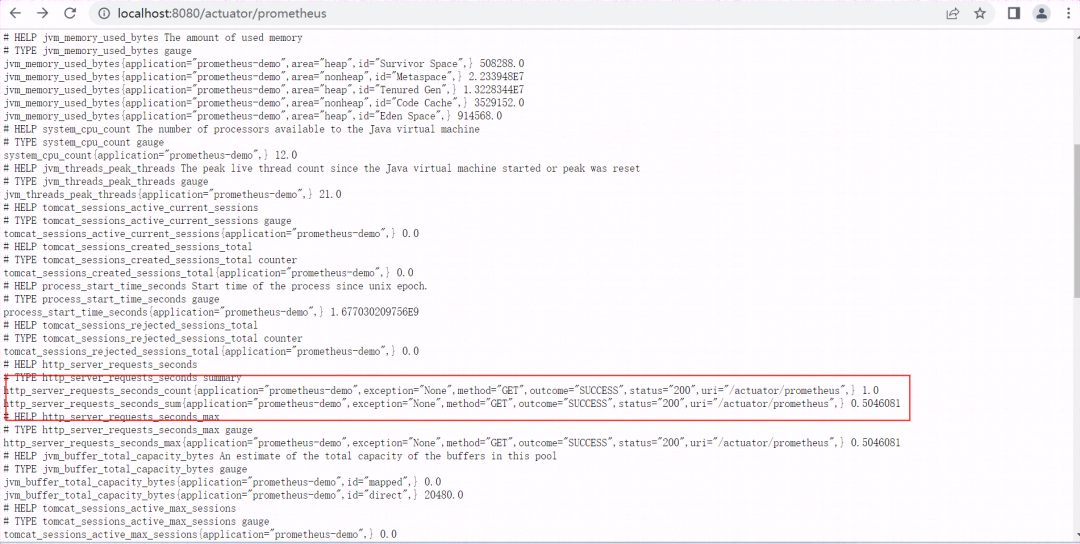
访问以下接口
http://localhost:8080/
http://localhost:8080/test
再次访问
http://localhost:8080/actuator/prometheus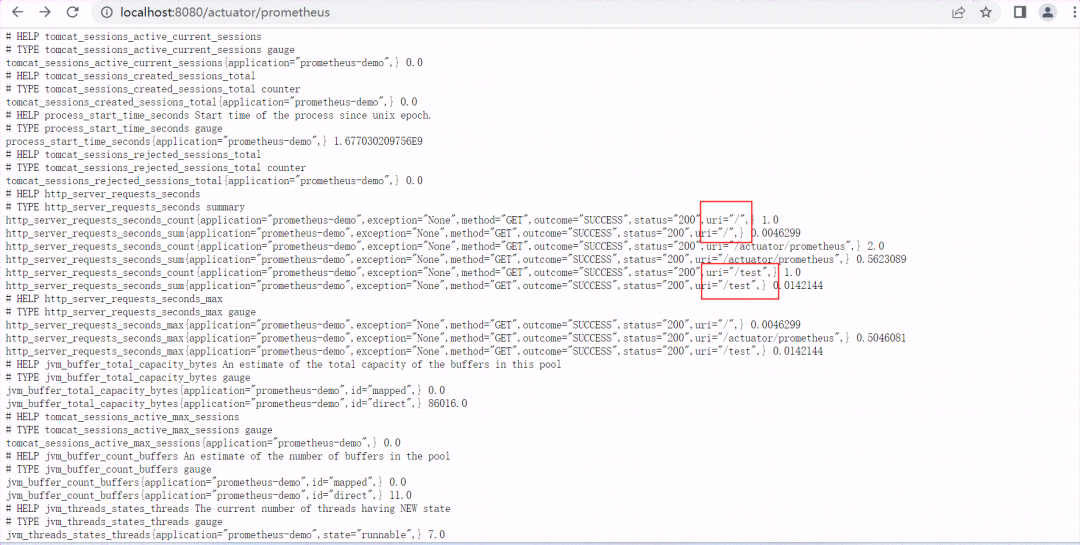
安全措施
如果上述请求接口不做任何安全限制,安全隐患显而易见。实际上Spring Boot也提供了安全限制功能。比如要禁用/env接口,则可设置如下:
endpoint:env:enabled: false另外也可以引入spring-boot-starter-security依赖
<dependency><groupId>org.springframework.boot</groupId><artifactId>spring-boot-starter-security</artifactId>
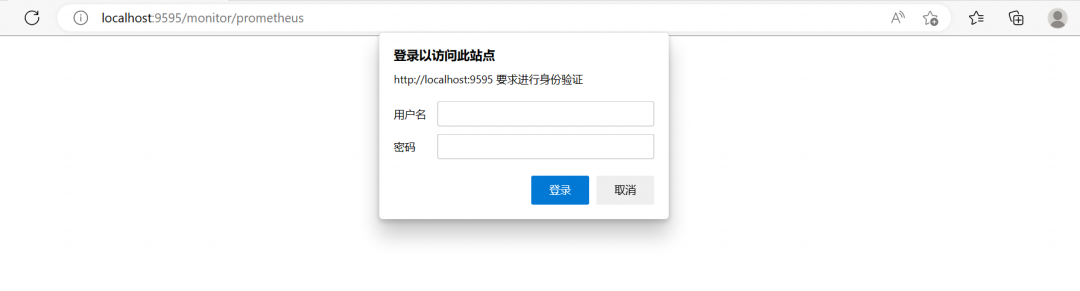
</dependency>在application.properties中开启security功能,配置访问权限验证,这时再访问actuator功能时就会弹出登录窗口,需要输入账号密码验证后才允许访问。
spring:security:user:name: adminpassword: abc321为了只对actuator功能做权限验证,其他应用接口不做认证,需要可以重新定制下SpringSecurity。
import org.springframework.beans.factory.annotation.Autowired;
import org.springframework.context.annotation.Configuration;
import org.springframework.core.env.Environment;
import org.springframework.security.config.annotation.web.builders.HttpSecurity;
import org.springframework.security.config.annotation.web.configuration.EnableWebSecurity;
import org.springframework.security.config.annotation.web.configuration.WebSecurityConfigurerAdapter;
import org.springframework.util.StringUtils;@Configuration
@EnableWebSecurity
public class ActuatorSecurityConfig extends WebSecurityConfigurerAdapter {@Autowiredprivate Environment env;@Overrideprotected void configure(HttpSecurity security) throws Exception {String monitorBasePath = env.getProperty("management.endpoints.web.base-path");String contextPath = env.getProperty("server.servlet.context-path");if(contextPath==null) {contextPath = "";}if(contextPath.endsWith("/")) {contextPath = contextPath.substring(0, contextPath.length()-1);}if (!StringUtils.isEmpty(monitorBasePath)) {if(!monitorBasePath.startsWith("/")) {monitorBasePath = "/" + monitorBasePath;}contextPath = contextPath + monitorBasePath + "/prometheus";}else {contextPath = contextPath + "/actuator/prometheus";}security.csrf().disable();security.authorizeRequests().antMatchers(contextPath, monitorBasePath + "/prometheus").authenticated().anyRequest().permitAll().and().httpBasic();}
}management.endpoints.web.base-path与server.servlet.context-path对应配置
再次访问此时需要进行权限验证。
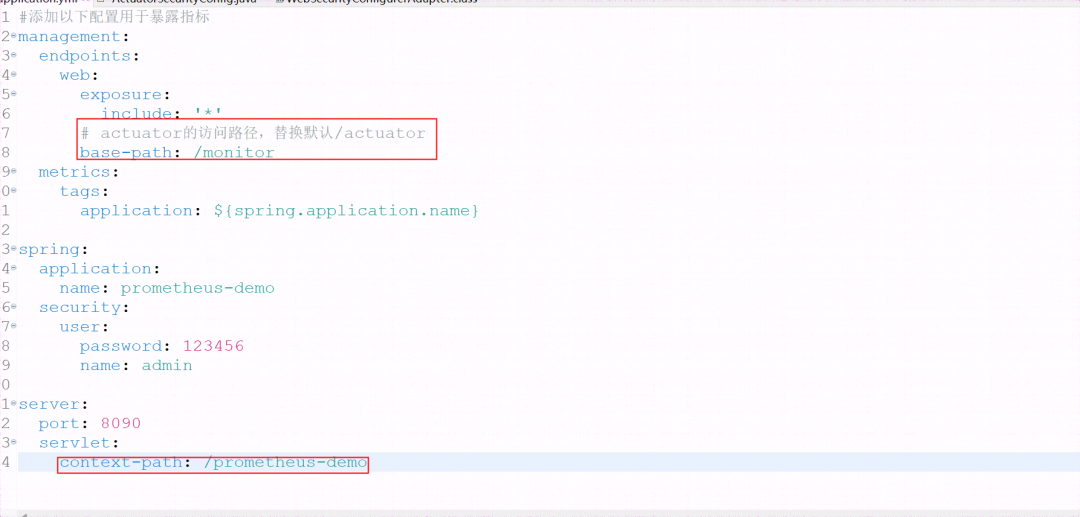
最终配置
#添加以下配置用于暴露指标
management:endpoints:web:exposure:include: '*'# actuator的访问路径,替换默认/actuatorbase-path: /monitormetrics:tags:application: ${spring.application.name}server:#新开监控端口,不和应用用同一个端口    port: 9595spring:application:name: prometheus-demosecurity:user:password: 123456name: adminserver:port: 8090servlet:context-path: /prometheus-demo