(matplotlib)如何让各个子图ax大小(宽度和高度)相等
文章目录
- 不相等
- 相等
import matplotlib.pyplot as plt
import numpy as np
plt.rc('font',family='Times New Roman')
import matplotlib.gridspec as gridspec
不相等
我用如下subplots代码画一行四个子图,
fig,(ax1,ax2,ax3,ax4)=plt.subplots(1,4,figsize=(20,10),dpi=300)
然后往各个子图中填充东西,可以最终得到四个大小不一样的子图,气死了。
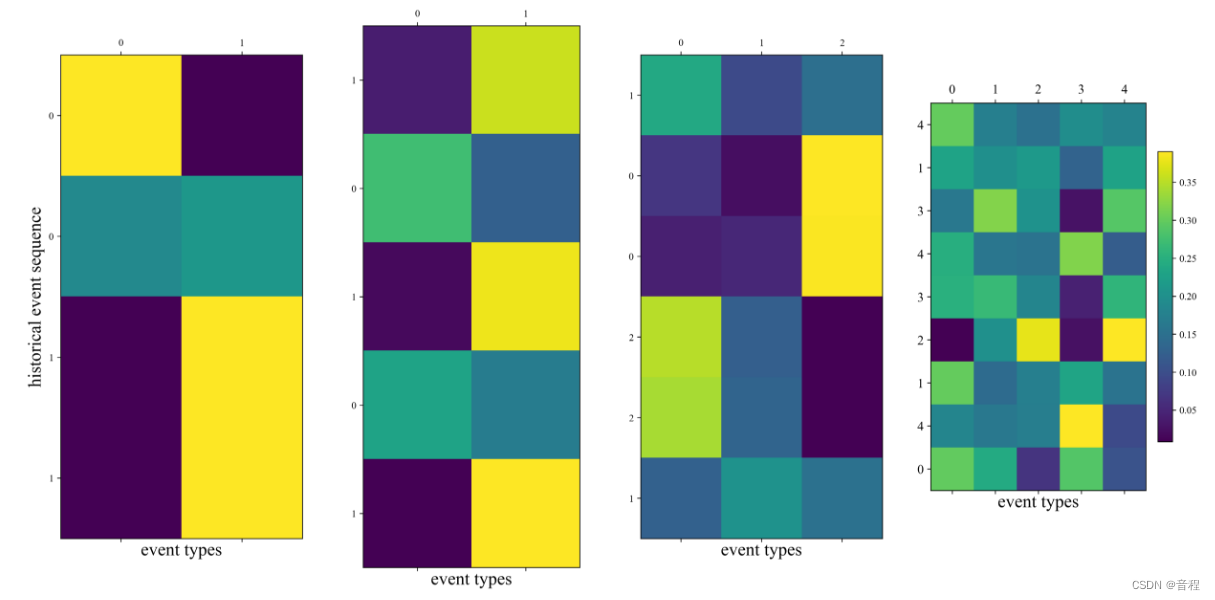
下面是源代码,虽然有点长,但是后面3个子图其实都是复制黏贴画第一个子图的代码而已。
fig,(ax1,ax2,ax3,ax4)=plt.subplots(1,4,figsize=(20,10),dpi=300)
plt.tick_params(labelsize=13)
font2 = {'family' : 'Times New Roman',
'weight' : 'normal',
'size'  : 18,
}
mat1=[[6.6653e-04, 1.1918e-04, 2.7586e-05, 6.7634e-06],[4.1138e-07, 1.3437e-04, 8.7720e-03, 9.9109e-01]]
mat2=[[0.0525, 0.0872, 0.0680, 0.1104, 0.0913],[0.1241, 0.0598, 0.1842, 0.0944, 0.2625]]
mat3=[[0.1099, 0.0782, 0.0827, 0.1141, 0.1160, 0.1113],[0.0670, 0.0602, 0.0869, 0.0607, 0.0646, 0.1443],[0.0828, 0.2043, 0.2473, 0.0332, 0.0344, 0.1214]]
mat4=[[0.1497, 0.0930, 0.0391, 0.1680, 0.0686, 0.0033, 0.1716, 0.1482,0.1557],[0.0867, 0.0803, 0.0777, 0.1071, 0.0728, 0.0809, 0.0816, 0.1320,0.1258],[0.0753, 0.0865, 0.0495, 0.1047, 0.0498, 0.1516, 0.0992, 0.1403,0.0341],[0.0978, 0.0529, 0.0065, 0.2158, 0.0117, 0.0104, 0.1325, 0.3183,0.1506],[0.0896, 0.0927, 0.0704, 0.0822, 0.0709, 0.1574, 0.0882, 0.0766,0.0555]]
m1=2
m2=2
m3=3
m4=5mat1=np.array(mat1).T
mat1=mat1/(mat1.sum(-1).reshape(-1,1))
ax1c=ax1.matshow(mat1)
# plt.colorbar(ax1c,fraction=0.07)
ax1.set_yticks([0,1,2,3])
ax1.set_yticklabels([0,0,1,1])
ax1.set_xticks(list(range(m1)))
ax1.set_xticklabels(list(range(m1)))
ax1.set_ylabel("historical event sequence",font2)
ax1.set_xlabel("event types",font2)mat2=np.array(mat2).T
mat2=mat2/(mat2.sum(-1).reshape(-1,1))
ax2c=ax2.matshow(mat2)
# plt.colorbar(ax2c,fraction=0.07)
ax2.set_yticks([0,1,2,3,4])
ax2.set_yticklabels([1, 0, 1, 0, 1])
ax2.set_xticks(list(range(m2)))
ax2.set_xticklabels(list(range(m2)))
# ax2.set_ylabel("history events",font2)
ax2.set_xlabel("event types",font2)mat3=np.array(mat3).T
mat3=mat3/(mat3.sum(-1).reshape(-1,1))
ax3c=ax3.matshow(mat3)
# plt.colorbar(ax3c,fraction=0.07)
ax3.set_yticks([0,1,2,3,4,5])
ax3.set_yticklabels([1, 0, 0, 2, 2, 1])
ax3.set_xticks(list(range(m3)))
ax3.set_xticklabels(list(range(m3)))
# ax3.set_ylabel("history events",font2)
ax3.set_xlabel("event types",font2)mat4=np.array(mat4).T
mat4=mat4/(mat4.sum(-1).reshape(-1,1))
ax4c=ax4.matshow(mat4)
ax4.set_yticks([0,1,2,3,4,5,6,7,8])
ax4.set_yticklabels([4, 1, 3, 4, 3, 2, 1, 4, 0])
ax4.set_xticks(list(range(m4)))
ax4.set_xticklabels(list(range(m4)))
# ax4.set_ylabel("history events",font2)
ax4.set_xlabel("event types",font2)plt.colorbar(ax4c,fraction=0.06)
plt.show()
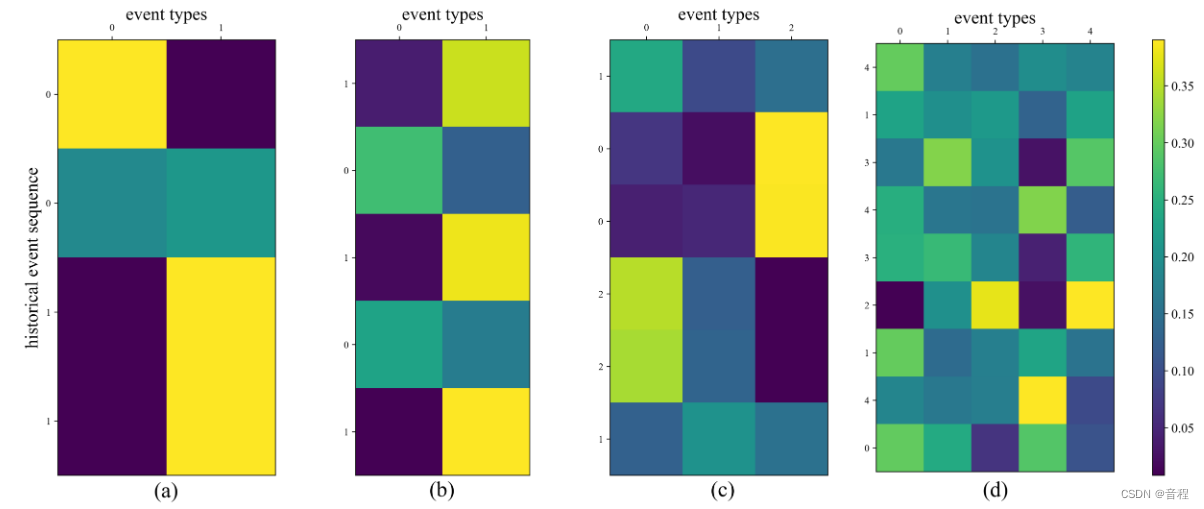
相等
百思不得其解,最后找了好久终于在网上找到了解决办法,但是你要我说为什么上面代码会不相等,我也不知道。
上面中,我唯一知道的就是最后一个图由于有colorbar这个东西,好像确实会导致整个子图变形,会和其他3个子图不一样,但是我仍然不知道为什么前面三个子图不是一样宽高。而且我还试了,即使不要colorbar,四个子图大小还是不一样。
不管了,反正我已经找到了解决办法。核心就是使用gridspec,这个东西是一个好东西,建议大家学一学,可能可以顺带解决很多其他大小问题。
核心代码如下,使用gridspec来创建5个子图(最后一个子图留出来放置colorbar)
fig=plt.figure(figsize=(20,8),dpi=300)
gs=gridspec.GridSpec(1, 5, width_ratios=[1,1,1,1,0.05])#指定各个子图的宽比例。
ax1 = plt.subplot(gs[0])
ax2 = plt.subplot(gs[1])
ax3 = plt.subplot(gs[2])
ax4 = plt.subplot(gs[3])
cax = plt.subplot(gs[4])
最终效果如下:
完整代码如下:
fig=plt.figure(figsize=(20,8),dpi=300)
gs=gridspec.GridSpec(1, 5, width_ratios=[1,1,1,1,0.05])
ax1 = plt.subplot(gs[0])
ax2 = plt.subplot(gs[1])
ax3 = plt.subplot(gs[2])
ax4 = plt.subplot(gs[3])
cax = plt.subplot(gs[4])
# fig,(ax1,ax2,ax3,ax4)=plt.subplots(1,4,figsize=(20,10),dpi=300)
plt.tick_params(labelsize=13)
font2 = {'family' : 'Times New Roman',
'weight' : 'normal',
'size'  : 18,
}
mat1=[[6.6653e-04, 1.1918e-04, 2.7586e-05, 6.7634e-06],[4.1138e-07, 1.3437e-04, 8.7720e-03, 9.9109e-01]]
mat2=[[0.0525, 0.0872, 0.0680, 0.1104, 0.0913],[0.1241, 0.0598, 0.1842, 0.0944, 0.2625]]
mat3=[[0.1099, 0.0782, 0.0827, 0.1141, 0.1160, 0.1113],[0.0670, 0.0602, 0.0869, 0.0607, 0.0646, 0.1443],[0.0828, 0.2043, 0.2473, 0.0332, 0.0344, 0.1214]]
mat4=[[0.1497, 0.0930, 0.0391, 0.1680, 0.0686, 0.0033, 0.1716, 0.1482,0.1557],[0.0867, 0.0803, 0.0777, 0.1071, 0.0728, 0.0809, 0.0816, 0.1320,0.1258],[0.0753, 0.0865, 0.0495, 0.1047, 0.0498, 0.1516, 0.0992, 0.1403,0.0341],[0.0978, 0.0529, 0.0065, 0.2158, 0.0117, 0.0104, 0.1325, 0.3183,0.1506],[0.0896, 0.0927, 0.0704, 0.0822, 0.0709, 0.1574, 0.0882, 0.0766,0.0555]]
m1=2
m2=2
m3=3
m4=5mat1=np.array(mat1).T
mat1=mat1/(mat1.sum(-1).reshape(-1,1))
ax1c=ax1.matshow(mat1)
# plt.colorbar(ax1c,fraction=0.07)
ax1.set_yticks([0,1,2,3])
ax1.set_yticklabels([0,0,1,1])
ax1.set_xticks(list(range(m1)))
ax1.set_xticklabels(list(range(m1)))
ax1.set_ylabel("historical event sequence",font2)
# 在顶部坐标轴设置标签
ax1.xaxis.set_label_position('top')
# 设置顶部坐标轴的刻度线,如果没有下面的代码,默认刻度标签在底部
ax1.xaxis.tick_top()
# 设置顶部坐标轴的标记
ax1.set_xlabel('event types',font2)mat2=np.array(mat2).T
mat2=mat2/(mat2.sum(-1).reshape(-1,1))
ax2c=ax2.matshow(mat2)
# plt.colorbar(ax2c,fraction=0.07)
ax2.set_yticks([0,1,2,3,4])
ax2.set_yticklabels([1, 0, 1, 0, 1])
ax2.set_xticks(list(range(m2)))
ax2.set_xticklabels(list(range(m2)))
# ax2.set_ylabel("history events",font2)
# 在顶部坐标轴设置标签
ax2.xaxis.set_label_position('top')
# 设置顶部坐标轴的刻度线,如果没有下面的代码,默认刻度标签在底部
ax2.xaxis.tick_top()
# 设置顶部坐标轴的标记
ax2.set_xlabel('event types',font2)mat3=np.array(mat3).T
mat3=mat3/(mat3.sum(-1).reshape(-1,1))
ax3c=ax3.matshow(mat3)
# plt.colorbar(ax3c,fraction=0.07)
ax3.set_yticks([0,1,2,3,4,5])
ax3.set_yticklabels([1, 0, 0, 2, 2, 1])
ax3.set_xticks(list(range(m3)))
ax3.set_xticklabels(list(range(m3)))
# ax3.set_ylabel("history events",font2)
# 在顶部坐标轴设置标签
ax3.xaxis.set_label_position('top')
# 设置顶部坐标轴的刻度线,如果没有下面的代码,默认刻度标签在底部
ax3.xaxis.tick_top()
# 设置顶部坐标轴的标记
ax3.set_xlabel('event types',font2)mat4=np.array(mat4).T
mat4=mat4/(mat4.sum(-1).reshape(-1,1))
ax4c=ax4.matshow(mat4)
ax4.set_yticks([0,1,2,3,4,5,6,7,8])
ax4.set_yticklabels([4, 1, 3, 4, 3, 2, 1, 4, 0])
ax4.set_xticks(list(range(m4)))
ax4.set_xticklabels(list(range(m4)))
# ax4.set_ylabel("history events",font2)
# 在顶部坐标轴设置标签
ax4.xaxis.set_label_position('top')
# 设置顶部坐标轴的刻度线,如果没有下面的代码,默认刻度标签在底部
ax4.xaxis.tick_top()
# 设置顶部坐标轴的标记
ax4.set_xlabel('event types',font2)plt.colorbar(ax4c,fraction=0.06,cax=cax)plt.text(-32.1,-0.011,"(a)",size=22)
plt.text(-23.25,-0.01,"(b)",size=22)
plt.text(-14.20,-0.01,"(c)",size=22)
plt.text(-5.45,-0.01,"(d)",size=22)plt.show()