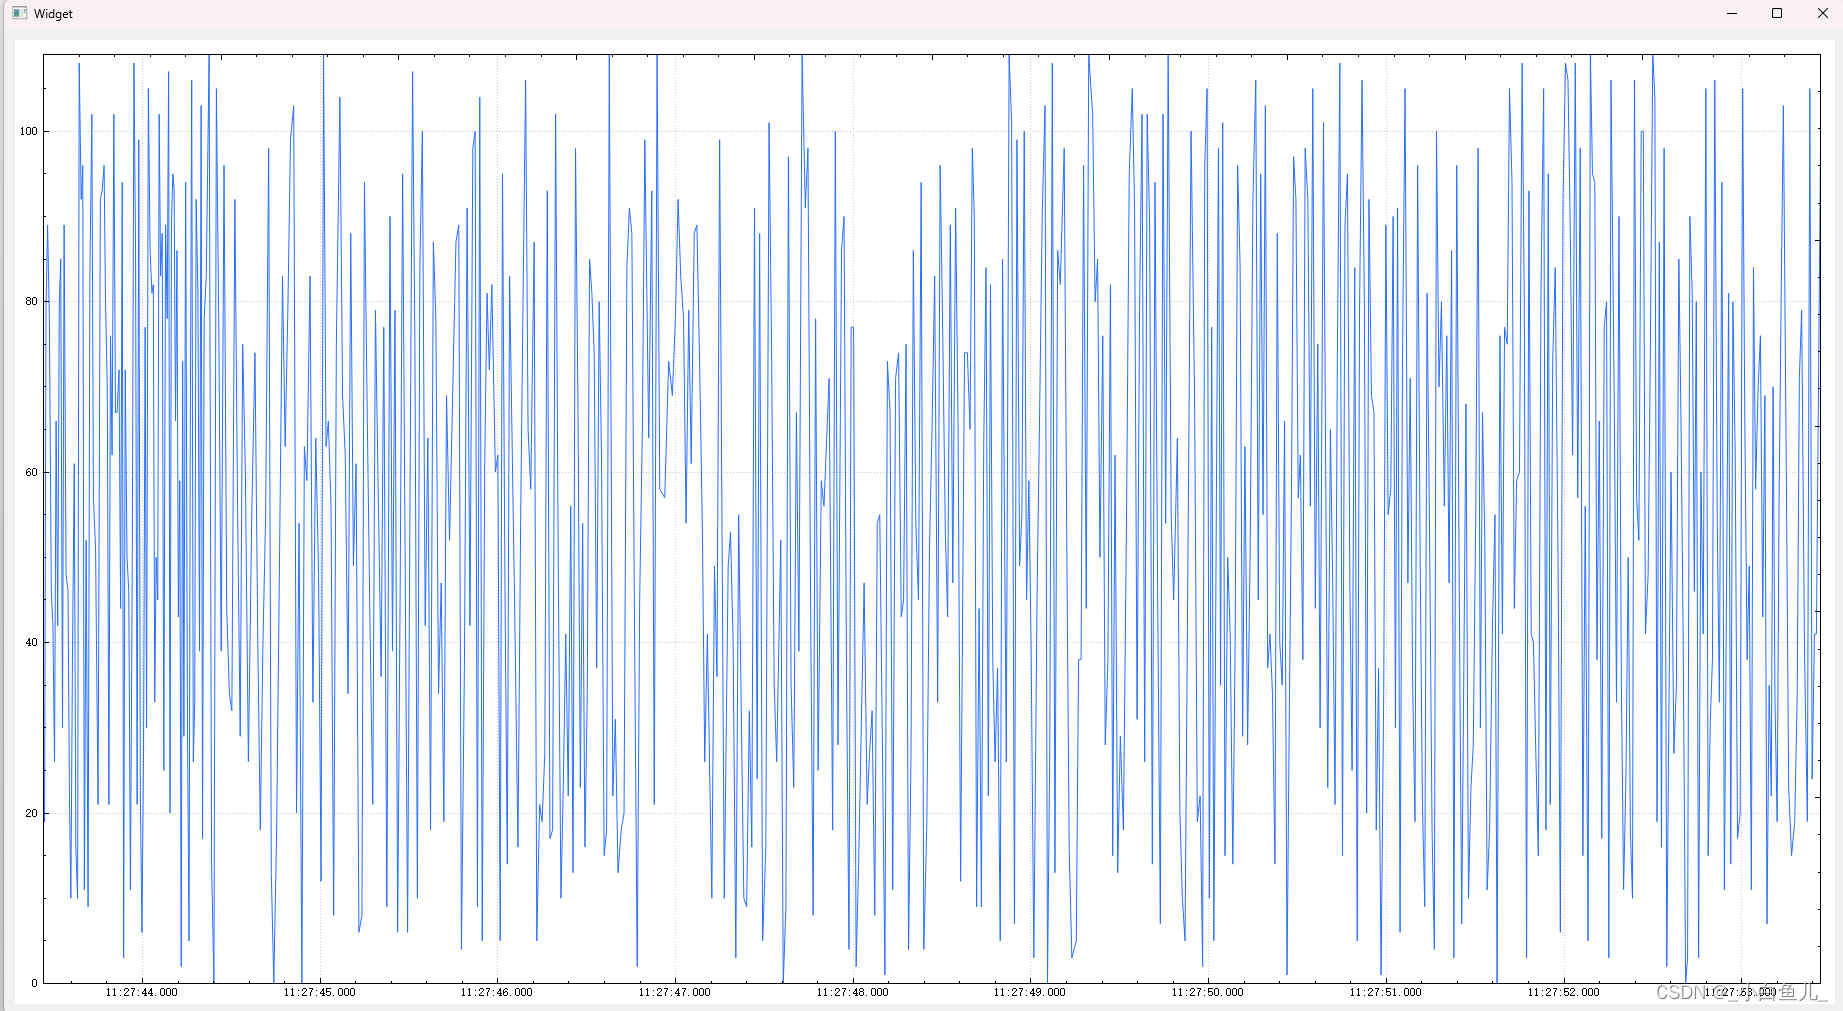
QCustomPlot横坐标为毫秒级的时间轴数据展示的实时刷新数据功能
头文件
#ifndef WIDGET_H
#define WIDGET_H#include <QWidget>
#include <QTimer>QT_BEGIN_NAMESPACE
namespace Ui { class Widget; }
QT_END_NAMESPACEclass Widget : public QWidget
{Q_OBJECTpublic:Widget(QWidget *parent = nullptr);~Widget();int realtimeDataSlot();
private:Ui::Widget *ui;QTimer* dataTimer;
};
#endif // WIDGET_H
源文件
#include "widget.h"
#include "ui_widget.h"Widget::Widget(QWidget *parent): QWidget(parent), ui(new Ui::Widget)
{ui->setupUi(this);dataTimer = new QTimer(this);ui->customPlot->addGraph();ui->customPlot->graph(0)->setPen(QPen(QColor(40, 110, 255)));//设置x轴格式QSharedPointer<QCPAxisTickerTime> timeTicker(new QCPAxisTickerTime);//设置tick个数timeTicker->setTickCount(10);//毫秒为单位timeTicker->setTimeFormat("%h:%m:%s.%z");ui->customPlot->xAxis->setTicker(timeTicker);ui->customPlot->axisRect()->setupFullAxesBox();//设置Y轴的范围ui->customPlot->yAxis->setRange(-1, 1);//设置x轴为当前时间int nowtime = QTime::currentTime().msecsSinceStartOfDay(); //获取精度为毫秒double key = nowtime;//设置初始坐标轴的x坐标ui->customPlot->xAxis->setRange(key * 0.001, 10, Qt::AlignRight);connect(dataTimer, &QTimer::timeout, this, &Widget::realtimeDataSlot);dataTimer->start(0);
}Widget::~Widget()
{delete ui;
}int Widget::realtimeDataSlot()
{//key, 8, Qt::AlignRightint nowtime = QTime::currentTime().msecsSinceStartOfDay();double key = nowtime;static double lastPointKey;//记录每次刷新数据的时候添加点的个数,此处只想知道时钟滴答准确性,没什么作用static int dataCount;if (key - lastPointKey >= 2) //两毫秒保存一个数据{//产生随机数,注意此处只是把x轴转为秒为单位展示,实际上还是毫秒级别ui->customPlot->graph(0)->addData(key*0.001, QRandomGenerator::global()->bounded(110));lastPointKey = key;dataCount++;}static double lastMoveKey;//下面的逻辑要基于自己的想法实现,主要是多少秒刷一次x轴和移动坐标轴的问题,我的想法是一秒移动一次if(key - lastMoveKey >= 1000){ui->customPlot->xAxis->setRange(key*0.001, 10, Qt::AlignRight);  //注意此处设置key点在最右侧//此处需要删除10秒前的数据ui->customPlot->graph(0)->data()->removeBefore(key*0.001-10);lastMoveKey = key;qDebug() << dataCount;dataCount=0;}//y轴自适应ui->customPlot->graph(0)->rescaleValueAxis();ui->customPlot->replot();return 0;
}