pythonocc进阶学习:投影projection
1.点 到 线,(直线,曲线)等上的投影
@staticmethod  # 点到Lin的投影
def Project_Pnt_To_Lin(p: gp_Pnt, lin: gp_Lin):Edge = BRepBuilderAPI_MakeEdge(lin).Edge()curve = BRep_Tool.Curve(Edge)proPnt = GeomAPI_ProjectPointOnCurve(p, curve[0])NearestPoint = proPnt.NearestPoint()return NearestPoint
2.点 到面上的投影
@staticmethod  # 点到Pln的投影
def project_point_on_plane(plane, point):pl = plane.Pln()aa, bb = projlib_Project(pl, point).Coord()point = plane.Value(aa, bb)return point
3.wire至shape上的投影:
参考:http://www.cppblog.com/eryar/archive/2016/08/16/214182.html
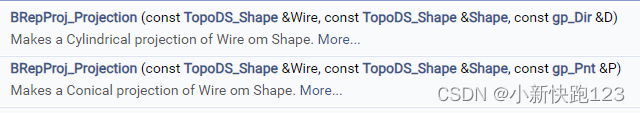
BRepProj_Projection
from OCC.Core.BRepBuilderAPI import BRepBuilderAPI_MakeEdge, BRepBuilderAPI_MakeWire, BRepBuilderAPI_Transform
from OCC.Core.BRepOffsetAPI import BRepOffsetAPI_ThruSections
from OCC.Core.BRepPrimAPI import BRepPrimAPI_MakeSphere
from OCC.Core.BRepProj import BRepProj_Projection
from OCC.Core.GC import GC_MakeArcOfCircle, GC_MakeSegment
from OCC.Core.TopoDS import topods
from OCC.Core.gp import gp_Pnt, gp_Trsf, gp_Dir,gp_OX
from OCC.Display.SimpleGui import init_displaydisplay, start_display, add_menu, add_function_to_menu = init_display()
sphere = BRepPrimAPI_MakeSphere(50).Shape()height = 70
width = 50
thickness = 30print("creating bottle")
# The points we'll use to create the profile of the bottle's body
aPnt1 = gp_Pnt(-width / 2.0, 0, 0)
aPnt2 = gp_Pnt(-width / 2.0, -thickness / 4.0, 0)
aPnt3 = gp_Pnt(0, -thickness / 2.0, 0)
aPnt4 = gp_Pnt(width / 2.0, -thickness / 4.0, 0)
aPnt5 = gp_Pnt(width / 2.0, 0, 0)aArcOfCircle = GC_MakeArcOfCircle(aPnt2, aPnt3, aPnt4)
aSegment1 = GC_MakeSegment(aPnt1, aPnt2)
aSegment2 = GC_MakeSegment(aPnt4, aPnt5)# Could also construct the line edges directly using the points instead of the resulting line
aEdge1 = BRepBuilderAPI_MakeEdge(aSegment1.Value())
aEdge2 = BRepBuilderAPI_MakeEdge(aArcOfCircle.Value())
aEdge3 = BRepBuilderAPI_MakeEdge(aSegment2.Value())# Create a wire out of the edges
aWire = BRepBuilderAPI_MakeWire(aEdge1.Edge(), aEdge2.Edge(), aEdge3.Edge())# Quick way to specify the X axis
xAxis = gp_OX()# Set up the mirror
aTrsf = gp_Trsf()
aTrsf.SetMirror(xAxis)# Apply the mirror transformation
aBRespTrsf = BRepBuilderAPI_Transform(aWire.Wire(), aTrsf)# Get the mirrored shape back out of the transformation and convert back to a wire
aMirroredShape = aBRespTrsf.Shape()# A wire instead of a generic shape now
aMirroredWire = topods.Wire(aMirroredShape)# Combine the two constituent wires
mkWire = BRepBuilderAPI_MakeWire()
mkWire.Add(aWire.Wire())
mkWire.Add(aMirroredWire)
myWireProfile = mkWire.Wire()
display.DisplayShape(myWireProfile, color='yellow', transparency=0.9, update=True)res = BRepProj_Projection(myWireProfile, Box1, gp_Dir(0, 0, 1)) # api
wire1 = res.Current()
res.Next()
wire2 = res.Current()generator = BRepOffsetAPI_ThruSections(True)
generator.AddWire(myWireProfile)
generator.AddWire(wire2)
generator.Build()
display.DisplayShape(generator.Shape(), color='black', transparency=0.9, update=True)
display.DisplayShape(sphere, color='black', transparency=0.9, update=True)
# display.DisplayShape(res.Current(), color='black', transparency=0.9, update=True)
start_display()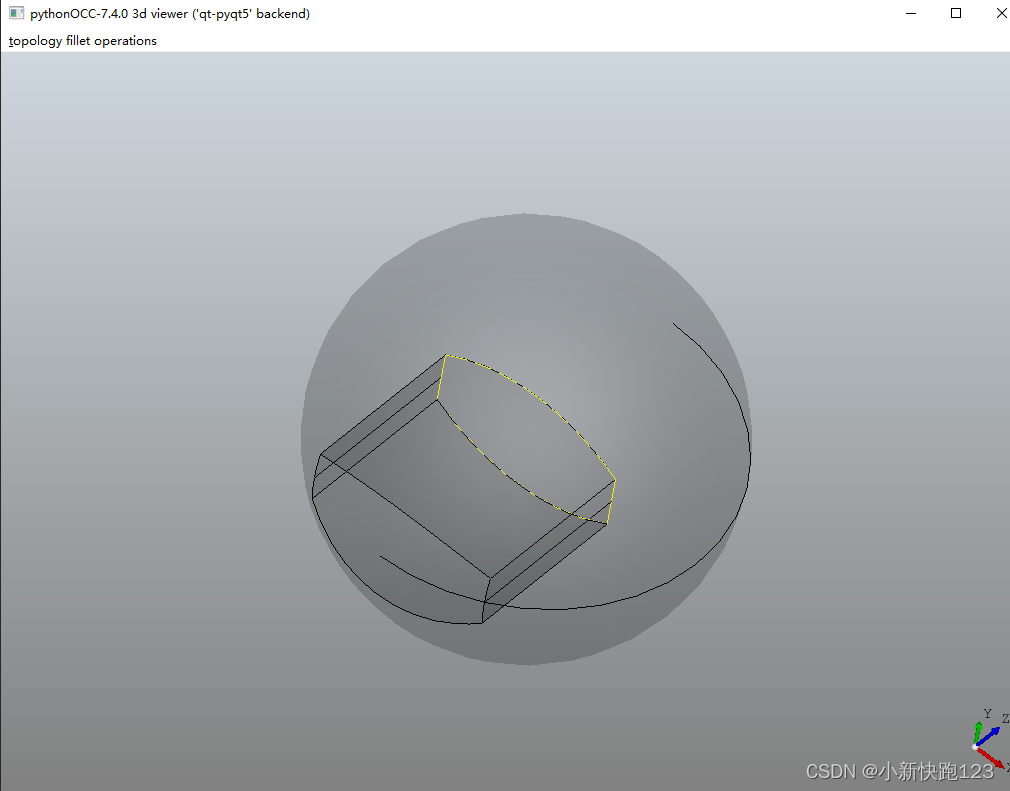
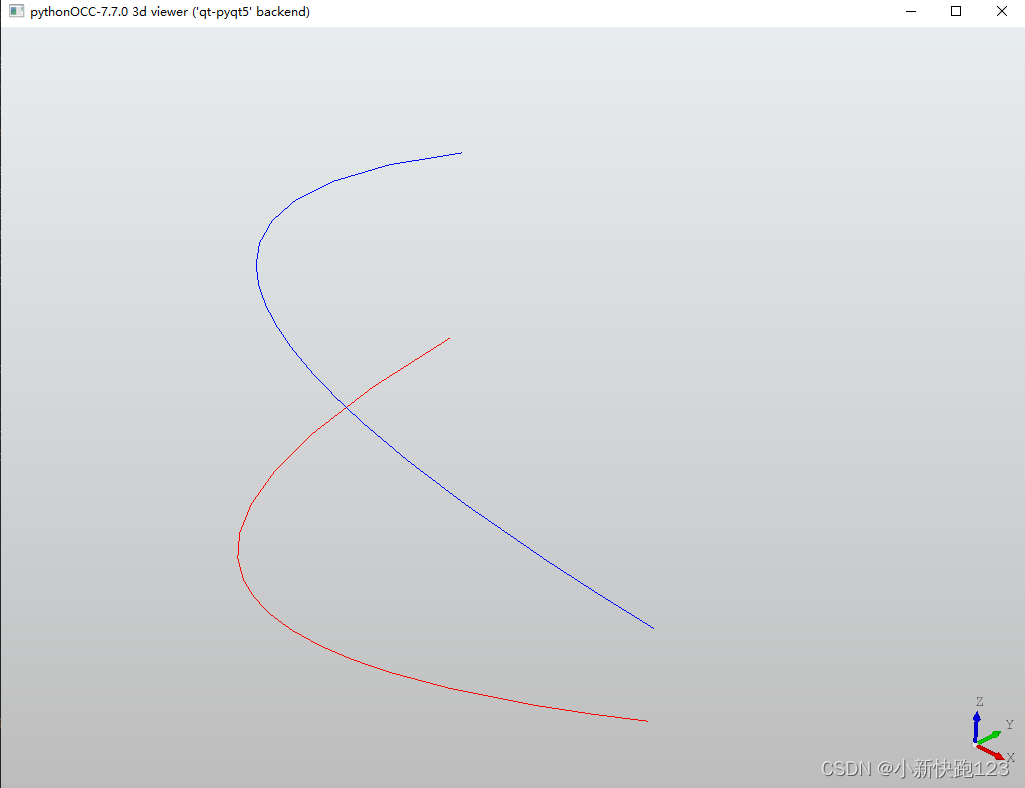
4.空间curve至pln的投影
GeomProjLib–》函数描述
from OCC.Core import GeomProjLib
from OCC.Core.Geom import Geom_Planefrom OCC.Core.gp import gp_Pnt, gp_Trsf, gp_Dir,gp_OX
from OCC.Display.SimpleGui import init_display
from OCC.Core.GeomAPI import GeomAPI_Interpolate
from OCC.Core.TColgp import TColgp_HArray1OfPnt
from OCC.Core.gp import gp_Pntdisplay, start_display, add_menu, add_function_to_menu = init_display()print("creating Plane")
plane = Geom_Plane(gp_Pnt(0,0,0),gp_Dir(0,0,1))print("creating bspline")
points = []
points=TColgp_HArray1OfPnt(1,3)
p1=gp_Pnt(0,6,2)
p2=gp_Pnt(2,1,3)
p3=gp_Pnt(6,2,1)points.SetValue(1,p1)
points.SetValue(2,p2)
points.SetValue(3,p3)
interp=GeomAPI_Interpolate(points,False,0.0001)
interp.Perform()
curve=interp.Curve() #Geom_BsplineCurve# project
proj=GeomProjLib.geomprojlib.ProjectOnPlane(curve,plane, gp_Dir(0, 0, 1),True)# display original curve and projected curve
display.DisplayShape(curve,color='blue',update=True)
display.DisplayShape(proj, color='red', update=True)start_display()