MATLAB | 如何绘制这样的描边散点图?
part.-1 前前言
最近略忙可能更新的内容会比较简单,见谅哇,今日更新内容:


part.0 前言
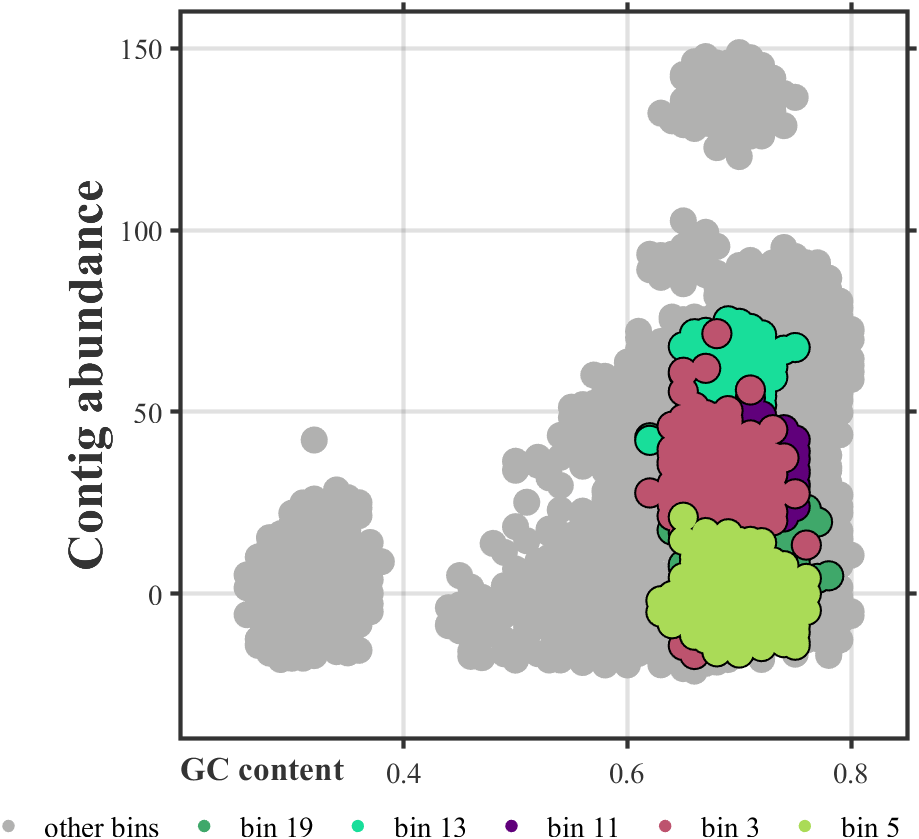
看到gzhBYtools科研笔记(推荐大家可以去瞅瞅,有很多有意思的图形的R语言复现!!)做了这样一张图:

感觉很有意思,但是作者是使用 R语言+Adobe illustrator 进行完成的,于是俺就想试试能不能用 MATLAB来进行完成。该图是出自论文:
- Li, Pu-Dong & Zhu, Zeng-Rong & Zhang, Yunzeng & Xu, Jianping & Wang, Hongkai & Wang, Zhengyi & Li, Hongye. (2022). The phyllosphere microbiome shifts toward combating melanose pathogen. Microbiome. 10. 10.1186/s40168-022-01234-x.
其中的Figure.6的图A:

想要下载文章可以通过将以下链接复制到浏览器打开来实现:
- https://www.researchgate.net/journal/Microbiome-2049-2618/publication/359692392_The_phyllosphere_microbiome_shifts_toward_combating_melanose_pathogen/links/6248fec18068956f3c6532fa/The-phyllosphere-microbiome-shifts-toward-combating-melanose-pathogen.pdf
当然我的文末所给出的Gitee仓库也给出了pdf文件,可以下载下来看。
part.1 核心函数
就是将scatter函数画两遍散点,一遍有边缘,另一遍删掉边缘,同时设置其中一次绘图不在图例中显示即可,也就三五行代码的一个小小小函数,可以新建m文件(Matlab-file)保存一下,或者直接放在代码最后即可。
function stHdl = strokeScatter(varargin)set(gca,'NextPlot','add');scHdl = scatter(varargin{:});stHdl = scatter(varargin{:},'MarkerEdgeColor','none');scHdl.Annotation.LegendInformation.IconDisplayStyle='off';
end
part.2 使用及复刻
基本使用
使用数据(所用数据见文末Gitee仓库)直接循环绘图就已经很像了:
% BinningDemo
Date  = readtable('binningData.txt','Delimiter',',');
% Group = flipud(unique(Date.group))
Group = {'other bins'; 'bin 19'; 'bin 13'; 'bin 11'; 'bin 3'; 'bin 5'};
CList = [177,177,176; 63,168,106; 24,222,154;96,0,123; 189,83,110; 170,219,87]./255;figure('Units','normalized','Position',[.2,.3,.4,.6]);
% 循环绘制散点
for i = 1:length(Group)ind  = strcmp(Date.group,Group(i));binX = Date.X(ind);binY = Date.Y(ind);if i == 1strokeScatter(binX,binY,170,'filled','CData',CList(i,:),...'MarkerEdgeColor','none');elsestrokeScatter(binX,binY,170,'filled','CData',CList(i,:),...'MarkerEdgeColor','k','LineWidth',2);end
end

坐标区域修饰
% 坐标区域修饰
ax = gca;
ax.PlotBoxAspectRatio = [1,1,1];
ax.Box = 'on';
ax.LineWidth = 2;
ax.FontName = 'Times New Roman';
ax.XGrid = 'on';
ax.YGrid = 'on';
ax.TickDir = 'out';
ax.XLim = [0.2,0.85];
ax.YTick = 0:50:150;
ax.XTick = 0.4:0.2:0.8;
ax.FontSize = 14;
ax.XColor = [.2,.2,.2];
ax.YColor = [.2,.2,.2];
% X轴副标签
ax.XRuler.SecondaryLabel.String = 'GC content';
ax.XRuler.SecondaryLabel.Position(1) = ax.XLim(1);
ax.XRuler.SecondaryLabel.HorizontalAlignment = 'left';
ax.XRuler.SecondaryLabel.FontSize = 16;
ax.XRuler.SecondaryLabel.VerticalAlignment = 'bottom';
ax.XRuler.SecondaryLabel.FontWeight = 'bold';
% Y轴标签
ax.YLabel.String = 'Contig abundance';
ax.YLabel.FontSize = 24;
ax.YLabel.FontWeight = 'bold';

添加图例
% 绘制图例
lgdHdl = legend(Group);
lgdHdl.NumColumns = length(Group);
lgdHdl.Location = 'southoutside';
lgdHdl.Box = 'off';
lgdHdl.FontSize = 14;
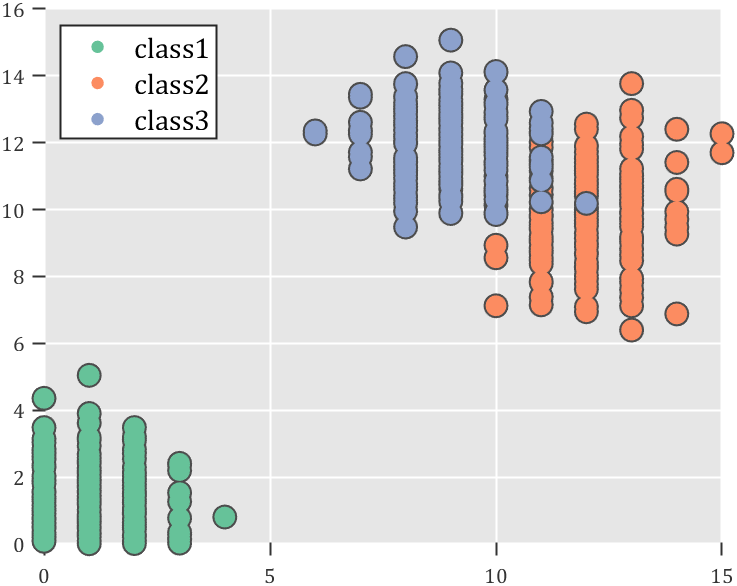
part.3 其他示例
这里随便写了点代码,懒得去想咋生成一团一团数据,干脆同时让X坐标取了个整,让点聚在了一起:
clc; clear; close all
rng(6)
% 生成随机点(Generate random points)
mu = [1 1; 12 10; 9 12];
S  = cat(3,[1 0; 0 2],[1 0; 0 2],[1 0; 0 1]);
r1 = abs(mvnrnd(mu(1,:),S(:,:,1),200));
r2 = abs(mvnrnd(mu(2,:),S(:,:,2),200));
r3 = abs(mvnrnd(mu(3,:),S(:,:,3),200));
% 绘制散点图(Draw scatter chart)
hold on
propCell = {'LineWidth',2,'MarkerEdgeColor',[.3,.3,.3],'SizeData',100};
strokeScatter(round(r1(:,1)),r1(:,2),'filled','CData',[0.40 0.76 0.60],propCell{:});
strokeScatter(round(r2(:,1)),r2(:,2),'filled','CData',[0.99 0.55 0.38],propCell{:});
strokeScatter(round(r3(:,1)),r3(:,2),'filled','CData',[0.55 0.63 0.80],propCell{:});
% 增添图例(Draw legend)
lgd = legend('class1','class2','class3');
lgd.Location = 'northwest';
lgd.FontSize = 14;
% 坐标区域基础修饰(Axes basic decoration)
ax=gca; grid on
ax.FontName   = 'Cambria';
ax.Color      = [0.9,0.9,0.9];
ax.Box        = 'off';
ax.TickDir    = 'out';
ax.GridColor  = [1 1 1];
ax.GridAlpha  = 1;
ax.LineWidth  = 1;
ax.XColor     = [0.2,0.2,0.2];
ax.YColor     = [0.2,0.2,0.2];
ax.TickLength = [0.015 0.025];
% 隐藏轴线(Hide XY-Ruler)
pause(1e-6)
ax.XRuler.Axle.LineStyle = 'none';
ax.YRuler.Axle.LineStyle = 'none';function stHdl = strokeScatter(varargin)set(gca,'NextPlot','add');scHdl = scatter(varargin{:});stHdl = scatter(varargin{:},'MarkerEdgeColor','none');scHdl.Annotation.LegendInformation.IconDisplayStyle='off';
end
完
再次推荐一下gzhBYtools科研笔记,虽然账号似乎建立时间不长但是有很多优质内容的!
本文所有代码及论文原文可在以下Gitee仓库获取:
https://gitee.com/slandarer/spdraw