ELK搭建
ELK概述
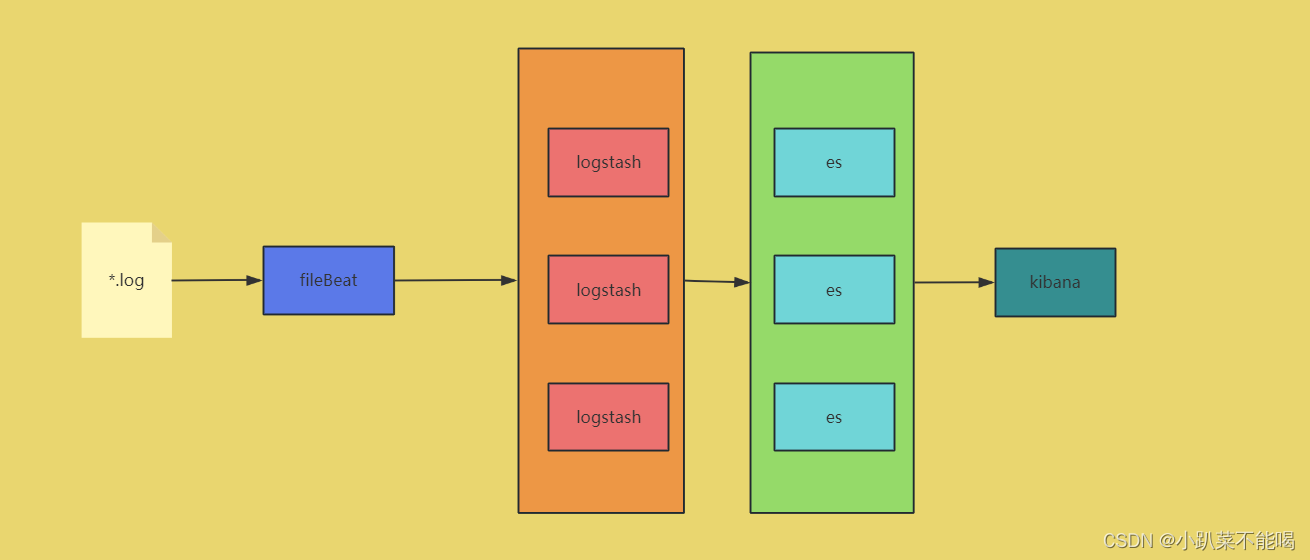
ELK是elasticsearch + Logstash + Kibana 这种架构的简写。这是一种日志分平台析的架构,
Elasticsearch + Logstash + filebeat + Kibana
这种架构增加了一个filebeat模块。filebeat是一个轻量的日志收集代理,用来部署在客户端,优势是消耗非常少的资源(较logstash), 所以生产中,往往会采取这种架构方式,但是这种架构有一个缺点,当logstash出现故障, 会造成日志的丢失
下载安装程序
社区下载会快一些:
https://elasticsearch.cn/download/
下载7.16.3版本
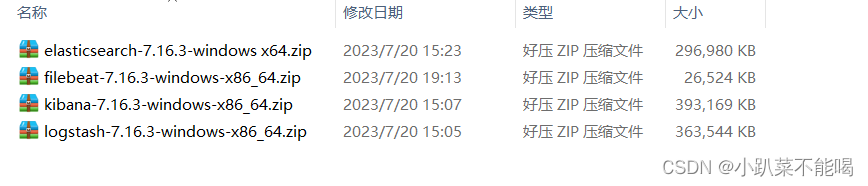
解压到elk目录
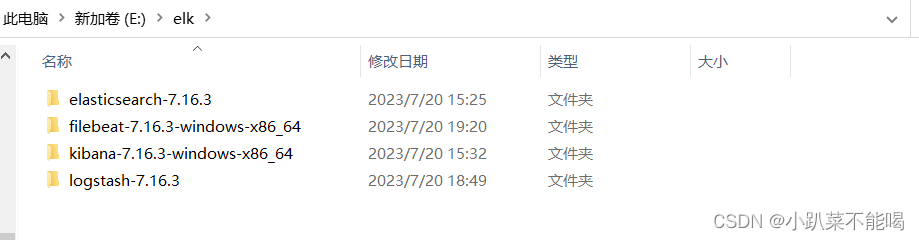
配置启动elk
配置启动es
修改config下elasticsearch.yml配置
# ======================== Elasticsearch Configuration =========================
#
# NOTE: Elasticsearch comes with reasonable defaults for most settings.
#       Before you set out to tweak and tune the configuration, make sure you
#       understand what are you trying to accomplish and the consequences.
#
# The primary way of configuring a node is via this file. This template lists
# the most important settings you may want to configure for a production cluster.
#
# Please consult the documentation for further information on configuration options:
# https://www.elastic.co/guide/en/elasticsearch/reference/index.html
#
# ---------------------------------- Cluster -----------------------------------
#
# Use a descriptive name for your cluster:
#
#cluster.name: my-application
#
# ------------------------------------ Node ------------------------------------
#
# Use a descriptive name for the node:
#
#node.name: node-1
#
# Add custom attributes to the node:
#
#node.attr.rack: r1
#
# ----------------------------------- Paths ------------------------------------
#
# Path to directory where to store the data (separate multiple locations by comma):
#
#path.data: /path/to/data
#
# Path to log files:
#
#path.logs: /path/to/logs
#
# ----------------------------------- Memory -----------------------------------
#
# Lock the memory on startup:
#
#bootstrap.memory_lock: true
#
# Make sure that the heap size is set to about half the memory available
# on the system and that the owner of the process is allowed to use this
# limit.
#
# Elasticsearch performs poorly when the system is swapping the memory.
#
# ---------------------------------- Network -----------------------------------
#
# By default Elasticsearch is only accessible on localhost. Set a different
# address here to expose this node on the network:
#
network.host: 0.0.0.1
#
# By default Elasticsearch listens for HTTP traffic on the first free port it
# finds starting at 9200. Set a specific HTTP port here:
#
http.port: 9200
#
# For more information, consult the network module documentation.
#
# --------------------------------- Discovery ----------------------------------
#
# Pass an initial list of hosts to perform discovery when this node is started:
# The default list of hosts is ["127.0.0.1", "[::1]"]
#
#discovery.seed_hosts: ["host1", "host2"]
#
# Bootstrap the cluster using an initial set of master-eligible nodes:
#
#cluster.initial_master_nodes: ["node-1", "node-2"]
#
# For more information, consult the discovery and cluster formation module documentation.
#
# ---------------------------------- Various -----------------------------------
#
# Require explicit names when deleting indices:
#
#action.destructive_requires_name: true
#
# ---------------------------------- Security ----------------------------------
#
#                                 *** WARNING ***
#
# Elasticsearch security features are not enabled by default.
# These features are free, but require configuration changes to enable them.
# This means that users don’t have to provide credentials and can get full access
# to the cluster. Network connections are also not encrypted.
#
# To protect your data, we strongly encourage you to enable the Elasticsearch security features.
# Refer to the following documentation for instructions.
#
# https://www.elastic.co/guide/en/elasticsearch/reference/7.16/configuring-stack-security.html
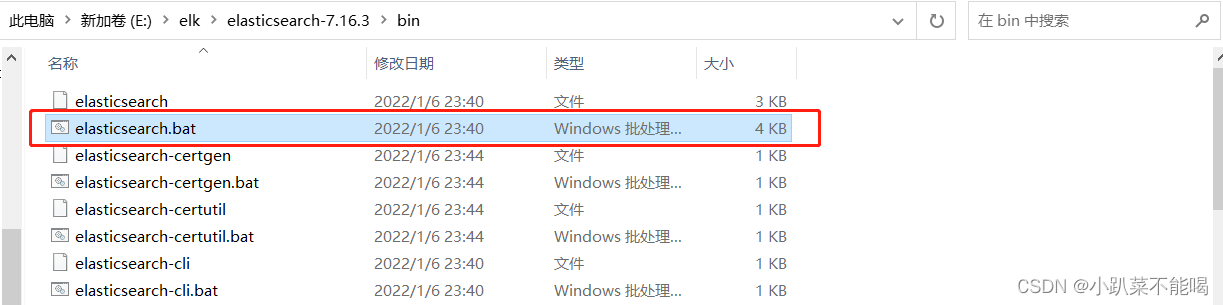
双击启动es
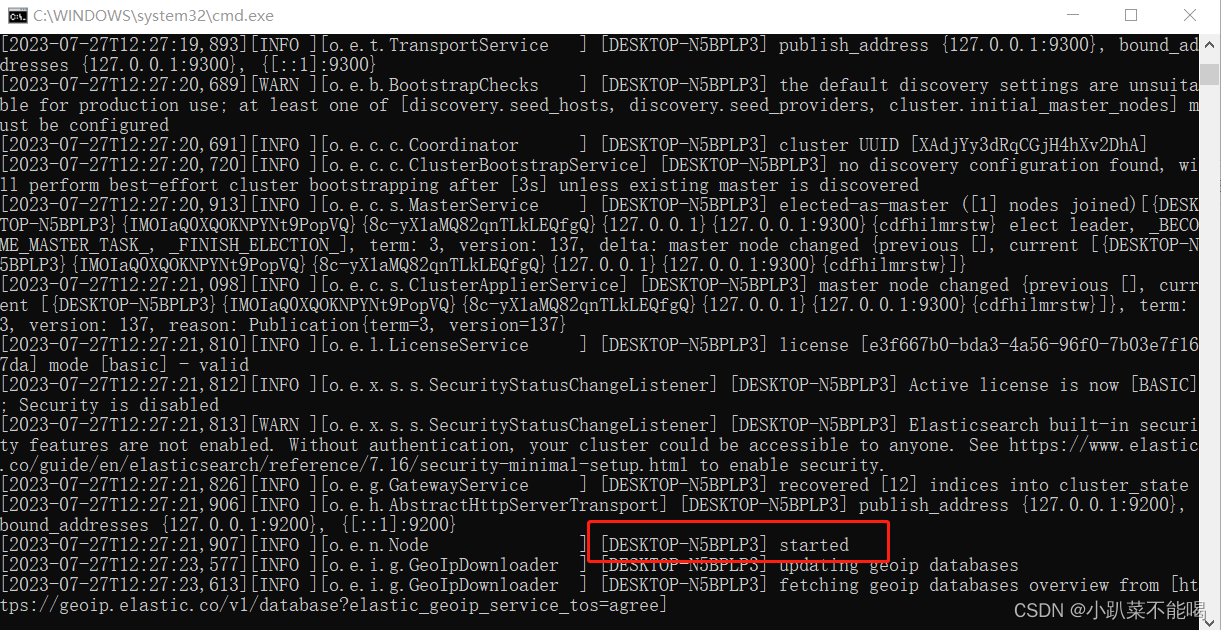
启动成功
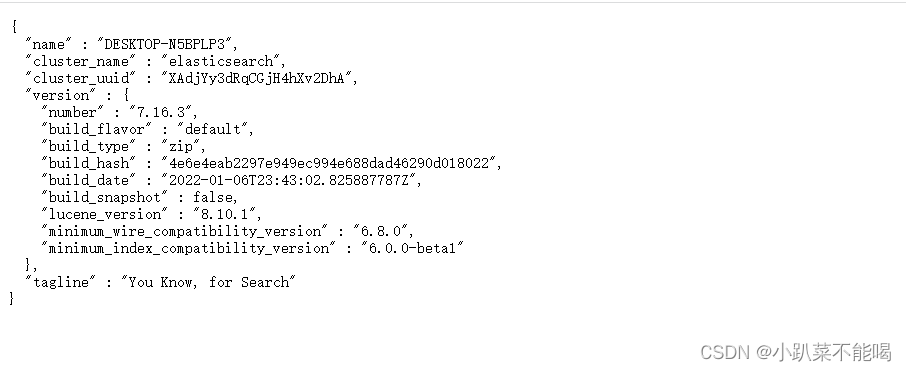
访问:http://localhost:9200/
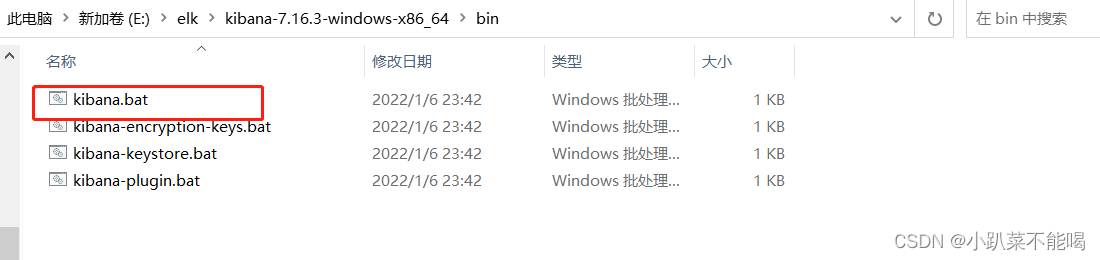
配置启动kibana
修改config下kibana.yml
# Kibana is served by a back end server. This setting specifies the port to use.
server.port: 5601
server.host: "localhost"
# The URLs of the Elasticsearch instances to use for all your queries.
elasticsearch.hosts: ["http://localhost:9200"]
i18n.locale: "zh-CN"
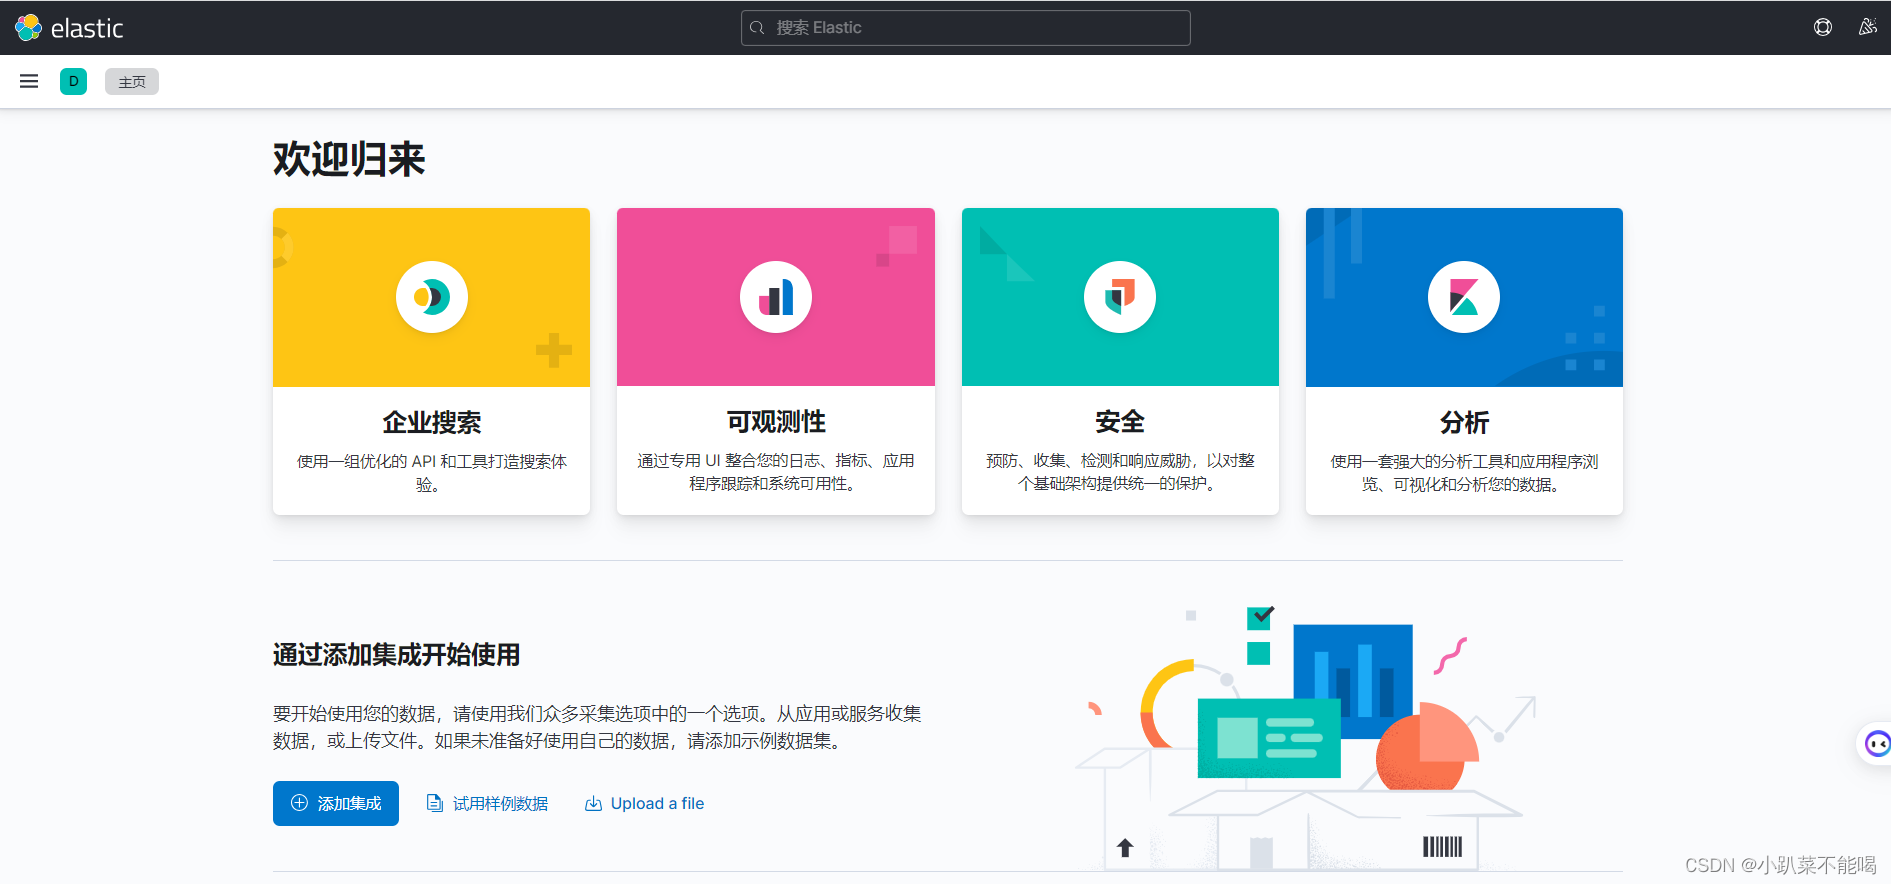
双击启动kibana
访问:http://localhost:5601/
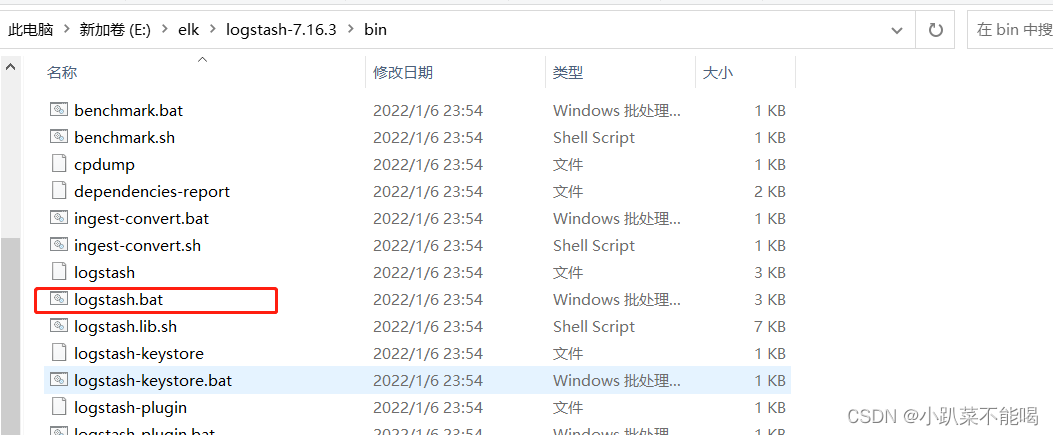
配置启动logstash
配置config下logstash.config
# Sample Logstash configuration for creating a simple
# Beats -> Logstash -> Elasticsearch pipeline.
input {beats {port => 5044}
}output {elasticsearch {hosts => ["http://localhost:9200"]index => "test"#user => "elastic"#password => "changeme"}
}
启动logstash
配置启动filebeat
配置filebeat下filebeat.yml
# ============================== Filebeat inputs ===============================filebeat.inputs:- type: filestream# Change to true to enable this input configuration.enabled: true# Paths that should be crawled and fetched. Glob based paths.paths:- E:/opt/excel-service-log/info/*.log# ======================= Elasticsearch template setting =======================setup.template.settings:index.number_of_shards: 1# =================================== Kibana ===================================# Starting with Beats version 6.0.0, the dashboards are loaded via the Kibana API.
# This requires a Kibana endpoint configuration.
setup.kibana:# Kibana Host# Scheme and port can be left out and will be set to the default (http and 5601)# In case you specify and additional path, the scheme is required: http://localhost:5601/path# IPv6 addresses should always be defined as: https://[2001:db8::1]:5601#host: "localhost:5601"# Kibana Space ID# ID of the Kibana Space into which the dashboards should be loaded. By default,# the Default Space will be used.#space.id:# =============================== Elastic Cloud ================================# These settings simplify using Filebeat with the Elastic Cloud (https://cloud.elastic.co/).# The cloud.id setting overwrites the `output.elasticsearch.hosts` and
# `setup.kibana.host` options.
# You can find the `cloud.id` in the Elastic Cloud web UI.
#cloud.id:# The cloud.auth setting overwrites the `output.elasticsearch.username` and
# `output.elasticsearch.password` settings. The format is `<user>:<pass>`.
#cloud.auth:# ================================== Outputs ===================================# Configure what output to use when sending the data collected by the beat.# ------------------------------ Logstash Output -------------------------------
output.logstash:
#   The Logstash hostshosts: ["localhost:5044"]# ================================= Processors =================================
processors:- add_host_metadata:when.not.contains.tags: forwarded- add_cloud_metadata: ~- add_docker_metadata: ~- add_kubernetes_metadata: ~
启动filebeat,根目录下 .\filebeat -e -c filebeat.yml
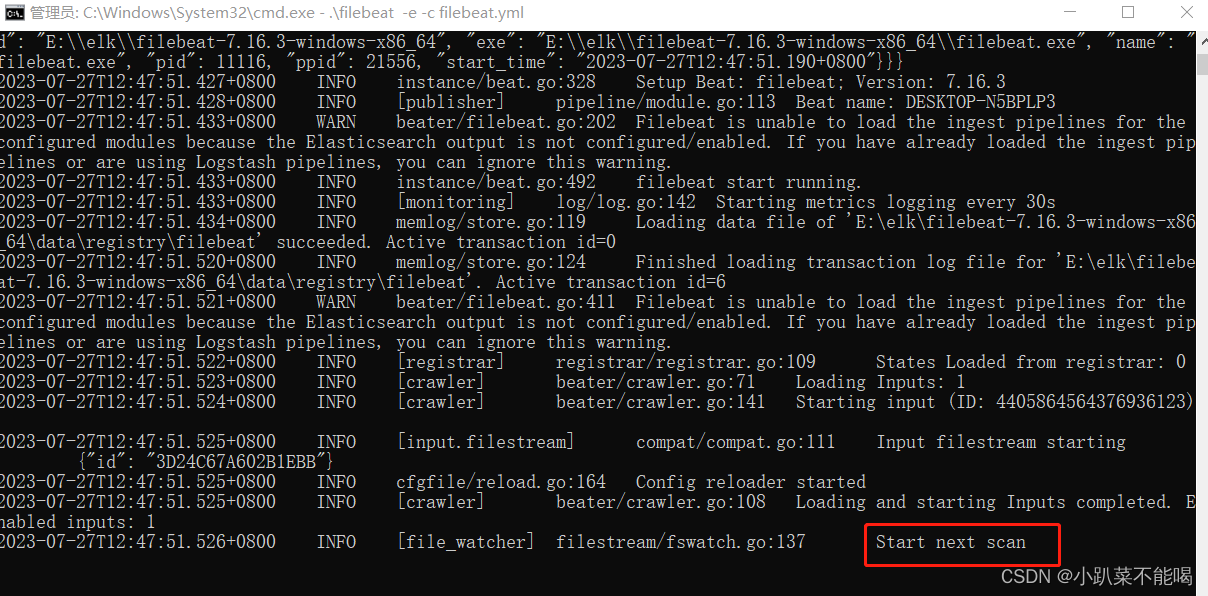
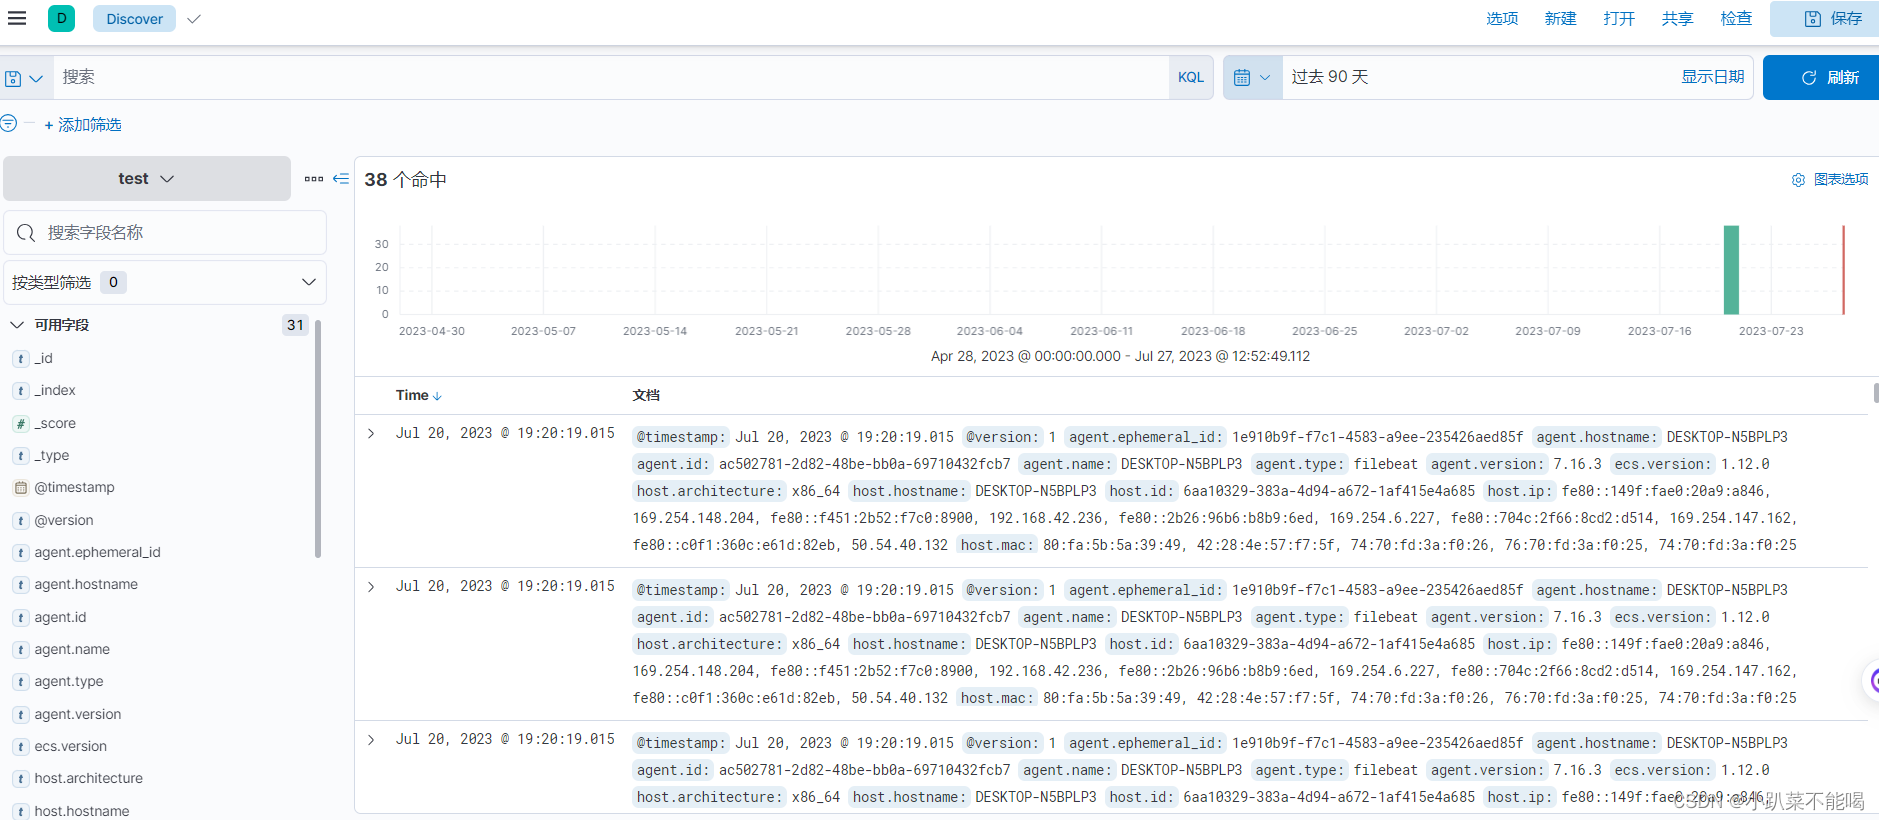
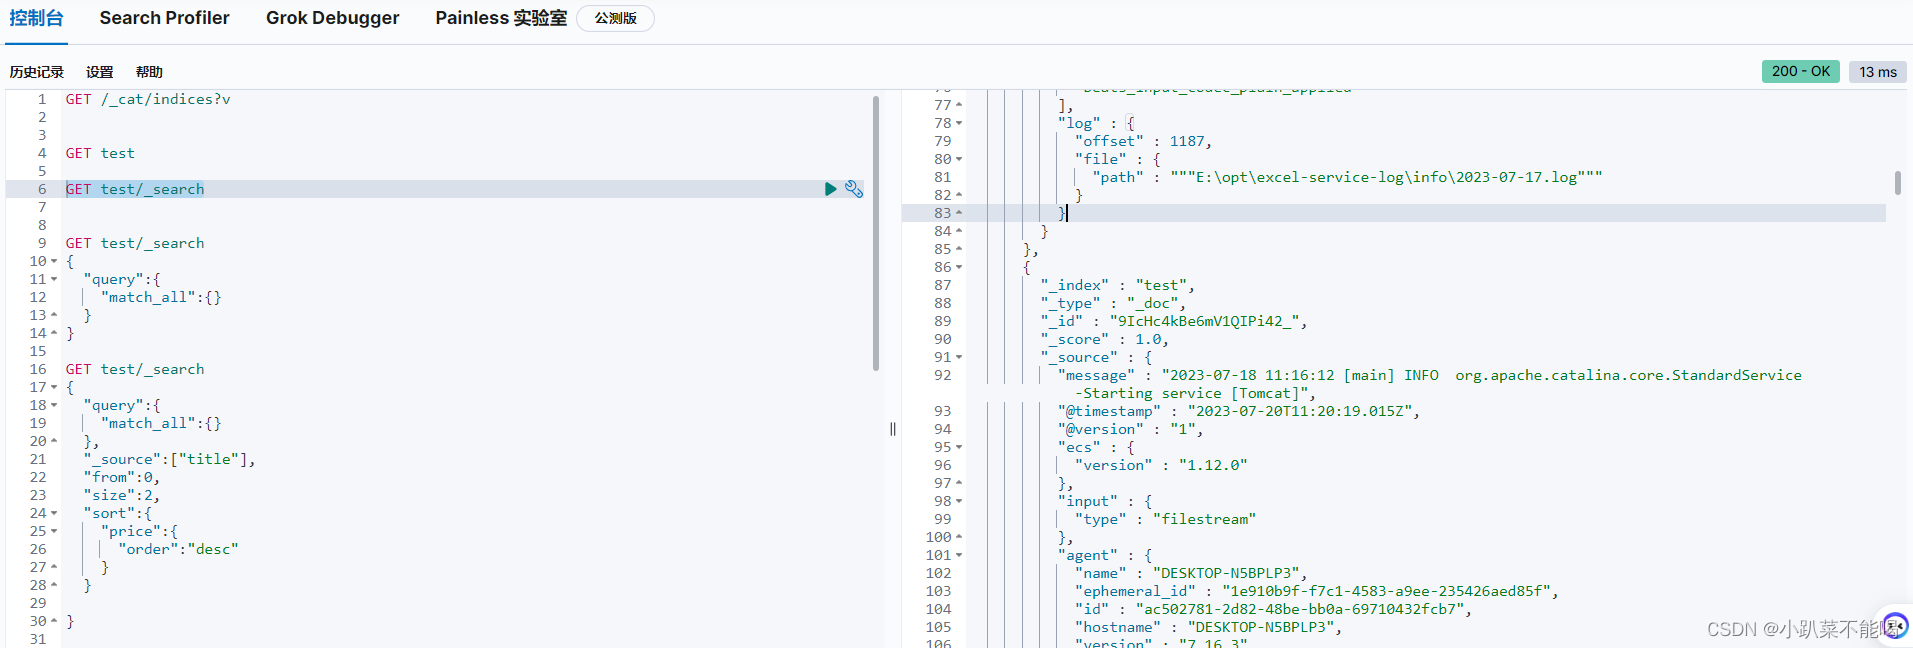
在kibana中查看日志监控效果