工程图矢量化 笔记 | potrace ezdxf svgpathtools | png转svg保存dxf用matplotlib画出来
python 把图片转为矢量图的库_mob649e815d65e6的技术博客_51CTO博客
sudo apt install potrace
from PIL import Image
import subprocess
def bitmap_to_svg(input_image_path, output_svg_path):image = Image.open(input_image_path)image = image.convert('1')  # 黑白图像bitmap_path = "temp.bmp"image.save(bitmap_path, "BMP")subprocess.run(['potrace', bitmap_path, '-s', '-o', output_svg_path])print(f"Converted {input_image_path} to {output_svg_path}")bitmap_to_svg("data/2.jpg", "output/output_image.svg")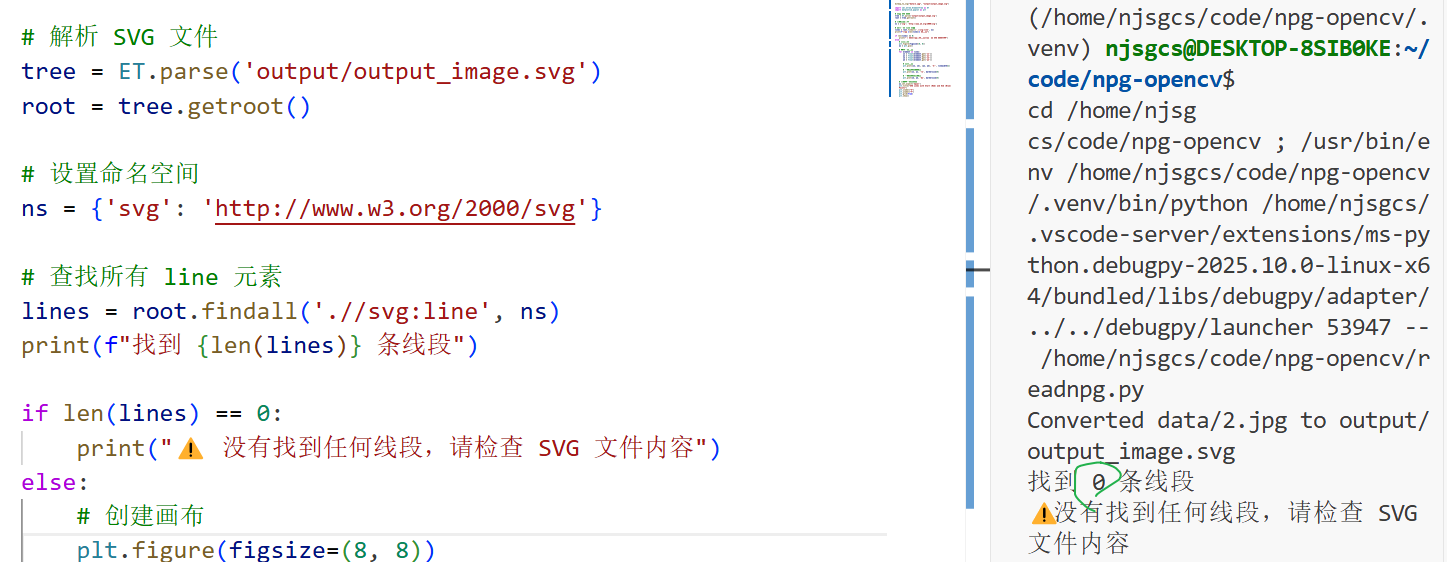
ai又在写鬼东西
svgpathtools matplotlib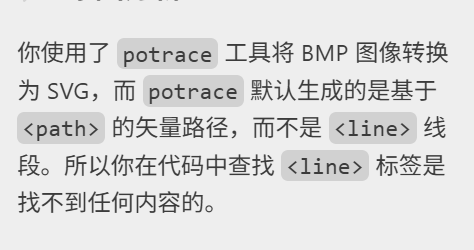
from svgpathtools import svg2paths
import ezdxf
# 解析 SVG 文件
paths, attributes = svg2paths('output/output_image.svg')# 创建一个新的 DXF 文档
doc = ezdxf.new(dxfversion='R2010')
msp = doc.modelspace()# 将 SVG 路径转换为 DXF 实体
for path in paths:for segment in path:if segment.__class__.__name__ == 'Line':start = (segment.start.real, segment.start.imag)end = (segment.end.real, segment.end.imag)msp.add_line(start, end, dxfattribs={'color': 5})elif segment.__class__.__name__ == 'CubicBezier':start = (segment.start.real, segment.start.imag)control1 = (segment.control1.real, segment.control1.imag)control2 = (segment.control2.real, segment.control2.imag)end = (segment.end.real, segment.end.imag)print('CubicBezier',start, control1, control2, end)msp.add_line(start, end, dxfattribs={'color': 1})elif segment.__class__.__name__ == 'Arc':center = (segment.center.real, segment.center.imag)radius = segment.radiusstart_angle = segment.start_angleend_angle = segment.end_anglemsp.add_arc(center=center, radius=radius, start_angle=start_angle, end_angle=end_angle)# 保存 DXF 文件
doc.saveas('output/output_image.dxf')
svg长这样
我本来以为svg是纯线段结构
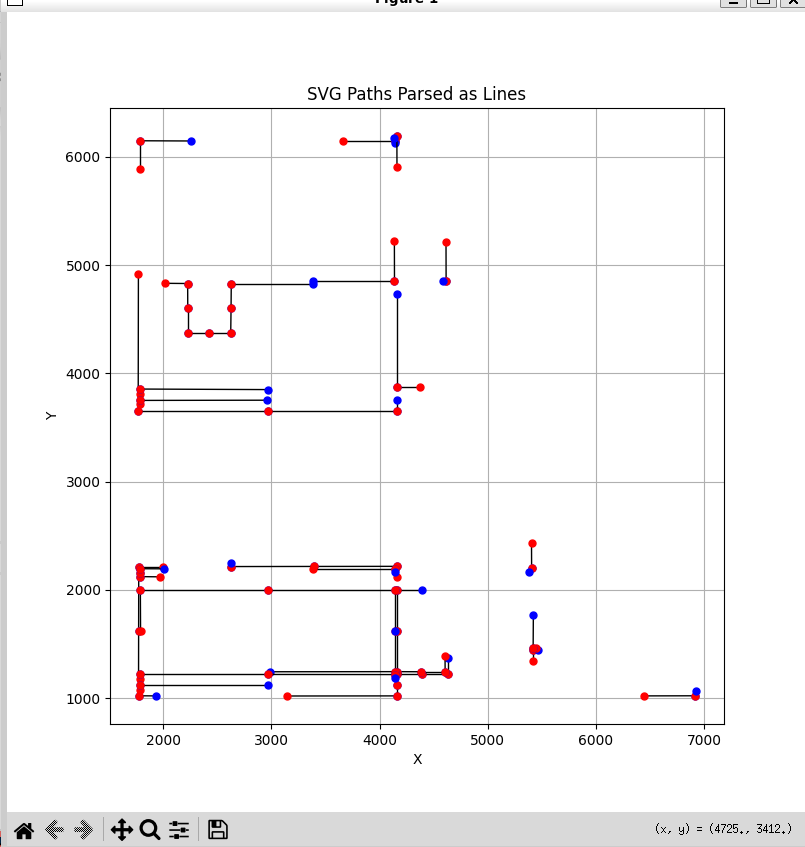
 CubicBezier红色多段线, 蓝色直线,圆弧黄色(没识别到)
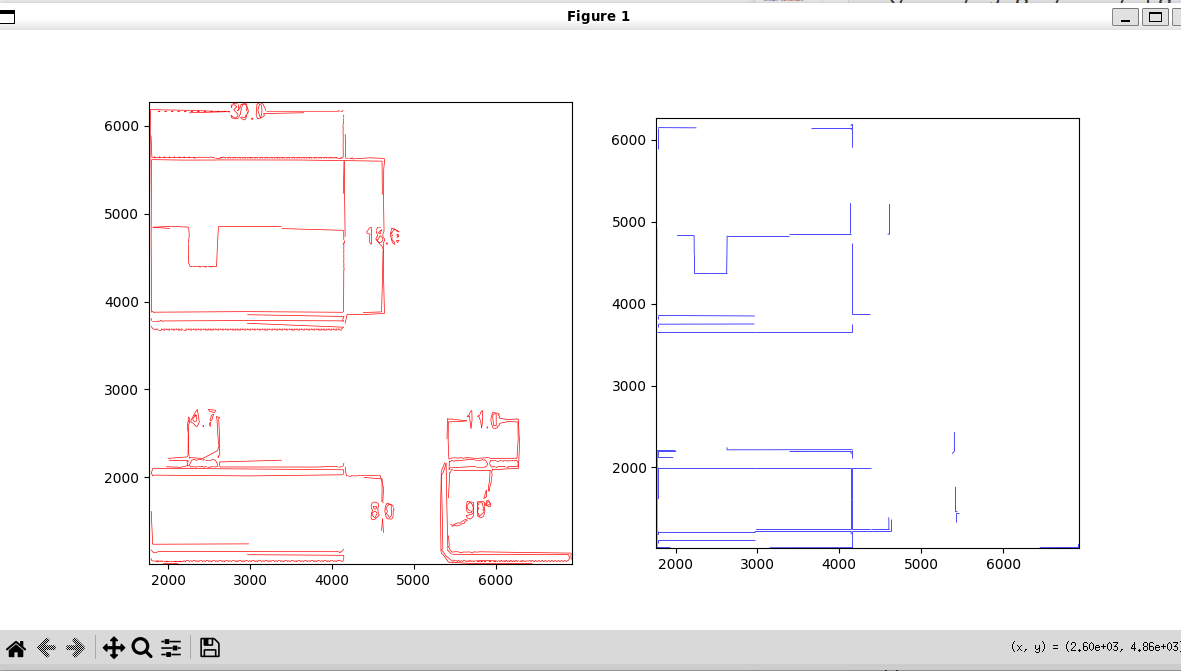
import ezdxf
import numpy as np
from matplotlib import pyplot as plt
from matplotlib.collections import LineCollection
from matplotlib.patches import Arc# 指定要读取的DXF文件路径
dxf_file_path = 'output/output_image.dxf'# 加载DXF文件
doc = ezdxf.readfile(dxf_file_path)
msp = doc.modelspace() # 获取模型空间# 创建一个图形对象和坐标轴对象
fig, (ax1, ax2) = plt.subplots(1, 2, figsize=(12, 6)) # 1行2列的子图布局# 准备一个列表用于存储所有的线段
rlines = []
blines = []
# 遍历模型空间中的所有实体
for entity in msp:if entity.dxftype() == 'LINE': # 如果是直线# 添加起点和终点到lines列表if entity.dxf.color==1:rlines.append([(entity.dxf.start.x, entity.dxf.start.y), (entity.dxf.end.x, entity.dxf.end.y)])elif entity.dxf.color==5:blines.append([(entity.dxf.start.x, entity.dxf.start.y), (entity.dxf.end.x, entity.dxf.end.y)])elif entity.dxftype() == 'SPLINE': # 如果是样条曲线fit_points = entity.control_pointsrlines.append([(fit_points[0][0], fit_points[0][1]), (fit_points[-1][0], fit_points[-1][1])])elif entity.dxftype() == 'ARC': # 如果是圆弧arc = entitycenter = (arc.dxf.center.x, arc.dxf.center.y)radius = arc.dxf.radiusstart_angle = arc.dxf.start_angleend_angle = arc.dxf.end_angleif start_angle > end_angle:end_angle += 360 # 确保角度范围正确# 使用matplotlib的Arc类绘制圆弧arc_patch = Arc(center, 2*radius, 2*radius, angle=0, theta1=start_angle, theta2=end_angle, color='blue', linewidth=0.5)ax.add_patch(arc_patch)else:print('未处理的实体类型:', entity.dxftype())# 使用LineCollection绘制所有的线段
line_segments_red = LineCollection(rlines, linewidths=0.5, colors='red')ax1.add_collection(line_segments_red)
line_segments_blue = LineCollection(blines, linewidths=0.5, colors='blue')
ax2.add_collection(line_segments_blue)# 设置坐标范围
lines=rlines + blines
ax1.set_xlim(min([min(l[0][0], l[1][0]) for l in lines])-5, max([max(l[0][0], l[1][0]) for l in lines])+5)
ax1.set_ylim(min([min(l[0][1], l[1][1]) for l in lines])-5, max([max(l[0][1], l[1][1]) for l in lines])+5)
ax2.set_xlim(min([min(l[0][0], l[1][0]) for l in lines])-5, max([max(l[0][0], l[1][0]) for l in lines])+5)
ax2.set_ylim(min([min(l[0][1], l[1][1]) for l in lines])-5, max([max(l[0][1], l[1][1]) for l in lines])+5)plt.gca().set_aspect('equal', adjustable='box') # 固定比例
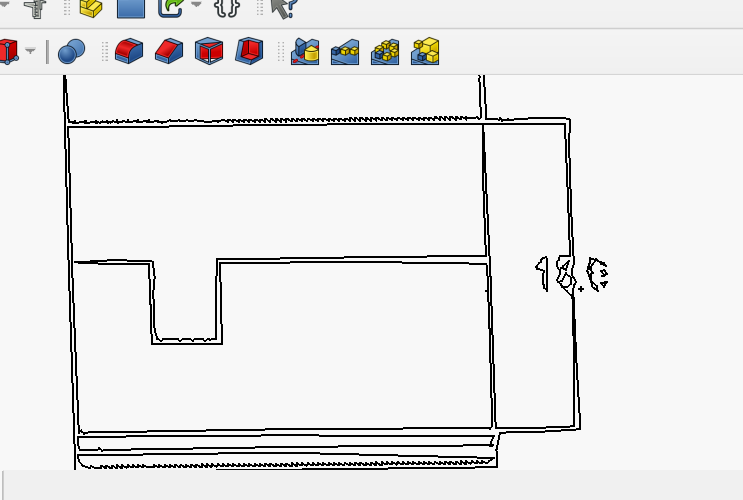
plt.show()转成svg对识别工程图不知道有没有用